> ## Documentation Index
> Fetch the complete documentation index at: https://ai-development-environment.mintlify.site/llms.txt
> Use this file to discover all available pages before exploring further.
# Build coverage report
> Review overall and changed code coverage for a build.
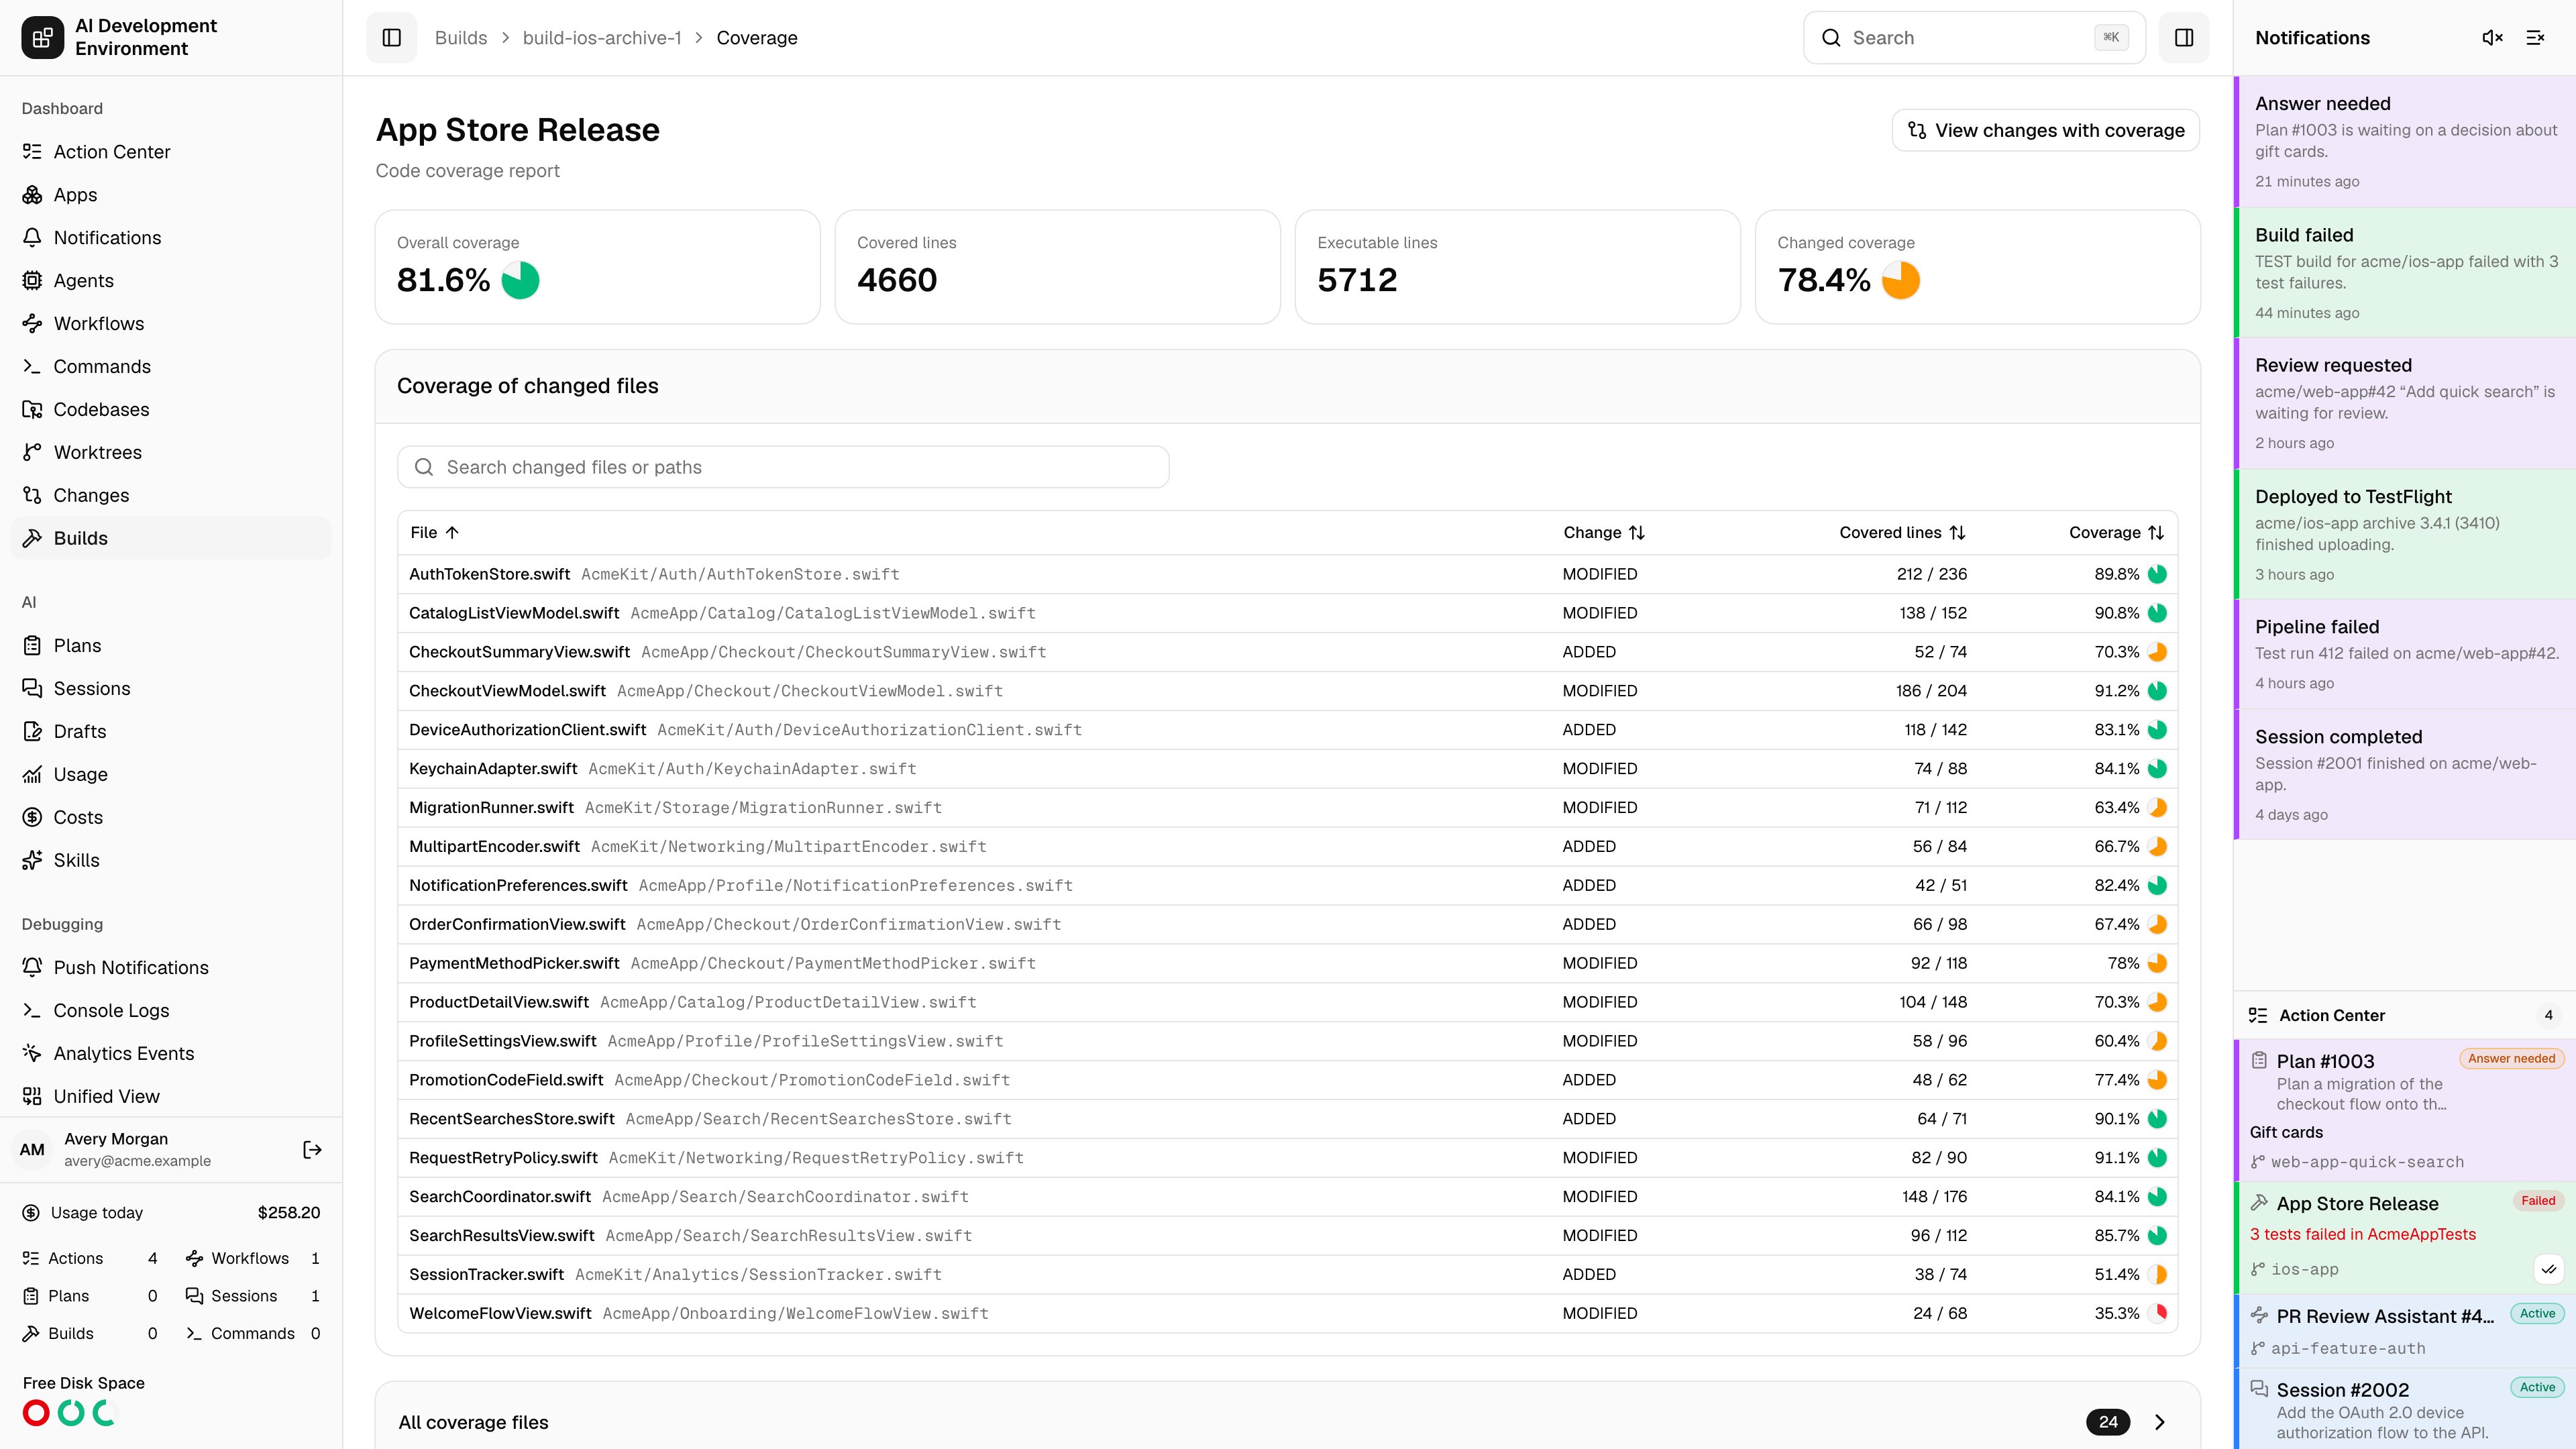
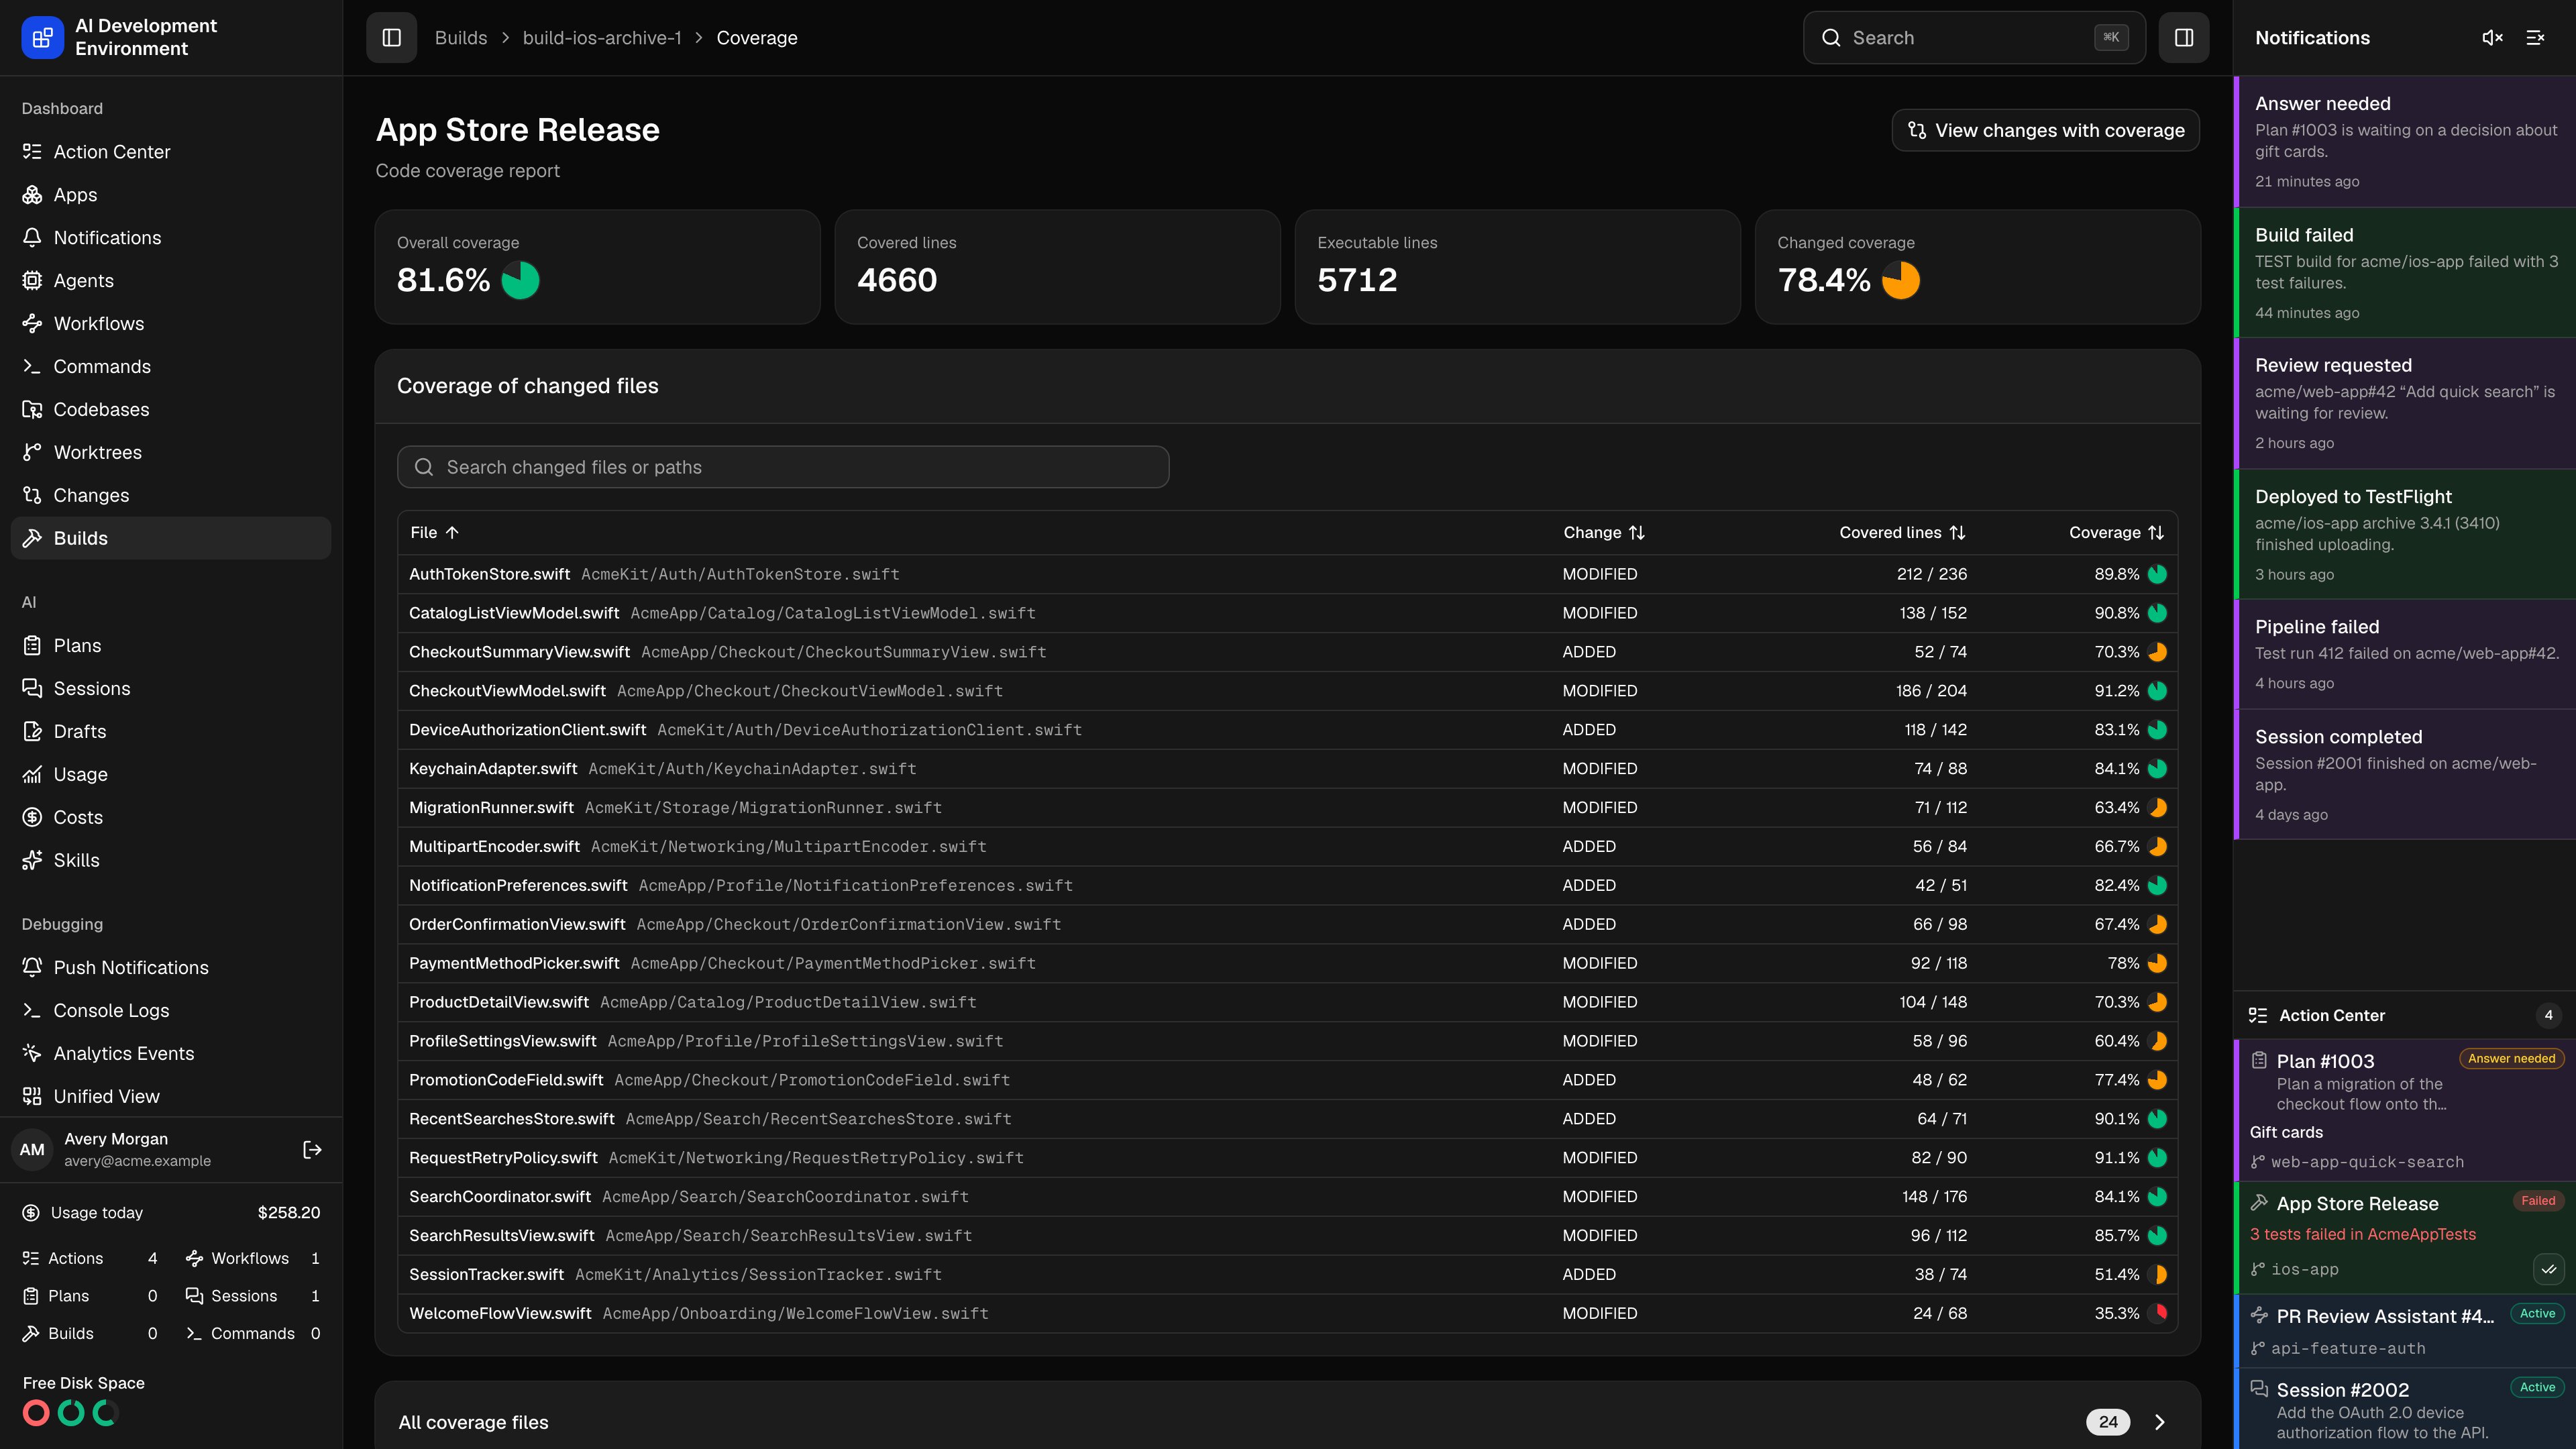 The build coverage page at `/builds/{id}/coverage` shows the code coverage report generated or imported for one build record.
An Xcode build has no coverage page until you generate the report. Open the [build details](/builds/build-detail) page and choose **Generate coverage report** first — until then this page tells you the report was not found. An imported report gets its own build record and opens here as soon as the import succeeds.
**View changes with coverage** opens the [Changes](/changes) page on the worktree this build measured, with this report already selected — the numbers below become a green-and-red strip against the actual diff.
## Headline numbers
| Metric | What it measures |
| -------------------- | ---------------------------------------------------- |
| **Overall coverage** | Coverage across the whole project |
| **Changed coverage** | Coverage restricted to the lines this branch changed |
| **Covered lines** | Executable lines the tests exercised |
| **Executable lines** | Lines that could be covered |
| **Uncovered lines** | Executable lines the tests never reached |
**Changed coverage** is the number worth reviewing on a pull request. Overall coverage moves slowly and mostly reflects the age of the codebase; changed coverage tells you whether the work in front of you is tested.
## Coverage of changed files
Files this branch touched, with their coverage and a **Change** marker describing how the file was modified. Search by changed file or path.
This table is empty when the branch has no changed source files — which is the expected state for a build made straight off the base branch.
## All coverage files
Every file in the report, grouped by target. Search across targets, files, and paths, sort by any column, and **Expand all** or **Collapse all** to move through targets quickly.
| Column | Notes |
| ------------ | -------------------------------------- |
| **Target** | The build target the file belongs to |
| **File** | File name |
| **Coverage** | Percentage of executable lines covered |
## Importing coverage from other test runners
You can import line coverage without running an Xcode build. The control agent accepts LCOV files such as `coverage/lcov.info` and Istanbul JSON such as `coverage/coverage-final.json`.
In a workflow, run the test suite with a **Terminal run** step, then add **Import coverage report** from the **Builds** group. Configure these fields:
| Field | What to enter |
| ------------------- | ------------------------------------------------------------------- |
| **Worktree** | The checkout where the test command wrote the report |
| **Coverage file** | A path inside that worktree; `coverage/lcov.info` is the default |
| **Coverage format** | **AUTO** to detect the file, or explicitly **LCOV** or **ISTANBUL** |
The import waits for the agent and creates a `HOST` build record because no simulator or device build ran. It writes `build.id` and `build.coverageSummary` to workflow session data. Add **Read code coverage** afterward when later steps need the per-file and changed-file lists.
The built-in `import_coverage_report` MCP tool provides the same operation with `worktreeId`, `reportPath`, `format`, and a caller-supplied `requestId`. You can run it from the [Tools](/system/tools) page or an MCP client.
The coverage file must stay inside the worktree, must describe at least one file, and cannot exceed 64 MiB. Import requires an online agent that supports coverage imports.
Changed-line coverage is measured against the worktree's base branch. If the branch or its remote reference cannot be resolved, the import still keeps whole-file coverage, but the changed-file breakdown and line overlay are unavailable.
## Related pages
Where an Xcode coverage report is generated, alongside logs, artifacts, and test results.
The same report, overlaid line by line on the branch's diff.
Worktree coverage reports, which measure the lines changed in a branch and its working tree.
The build coverage page at `/builds/{id}/coverage` shows the code coverage report generated or imported for one build record.
An Xcode build has no coverage page until you generate the report. Open the [build details](/builds/build-detail) page and choose **Generate coverage report** first — until then this page tells you the report was not found. An imported report gets its own build record and opens here as soon as the import succeeds.
**View changes with coverage** opens the [Changes](/changes) page on the worktree this build measured, with this report already selected — the numbers below become a green-and-red strip against the actual diff.
## Headline numbers
| Metric | What it measures |
| -------------------- | ---------------------------------------------------- |
| **Overall coverage** | Coverage across the whole project |
| **Changed coverage** | Coverage restricted to the lines this branch changed |
| **Covered lines** | Executable lines the tests exercised |
| **Executable lines** | Lines that could be covered |
| **Uncovered lines** | Executable lines the tests never reached |
**Changed coverage** is the number worth reviewing on a pull request. Overall coverage moves slowly and mostly reflects the age of the codebase; changed coverage tells you whether the work in front of you is tested.
## Coverage of changed files
Files this branch touched, with their coverage and a **Change** marker describing how the file was modified. Search by changed file or path.
This table is empty when the branch has no changed source files — which is the expected state for a build made straight off the base branch.
## All coverage files
Every file in the report, grouped by target. Search across targets, files, and paths, sort by any column, and **Expand all** or **Collapse all** to move through targets quickly.
| Column | Notes |
| ------------ | -------------------------------------- |
| **Target** | The build target the file belongs to |
| **File** | File name |
| **Coverage** | Percentage of executable lines covered |
## Importing coverage from other test runners
You can import line coverage without running an Xcode build. The control agent accepts LCOV files such as `coverage/lcov.info` and Istanbul JSON such as `coverage/coverage-final.json`.
In a workflow, run the test suite with a **Terminal run** step, then add **Import coverage report** from the **Builds** group. Configure these fields:
| Field | What to enter |
| ------------------- | ------------------------------------------------------------------- |
| **Worktree** | The checkout where the test command wrote the report |
| **Coverage file** | A path inside that worktree; `coverage/lcov.info` is the default |
| **Coverage format** | **AUTO** to detect the file, or explicitly **LCOV** or **ISTANBUL** |
The import waits for the agent and creates a `HOST` build record because no simulator or device build ran. It writes `build.id` and `build.coverageSummary` to workflow session data. Add **Read code coverage** afterward when later steps need the per-file and changed-file lists.
The built-in `import_coverage_report` MCP tool provides the same operation with `worktreeId`, `reportPath`, `format`, and a caller-supplied `requestId`. You can run it from the [Tools](/system/tools) page or an MCP client.
The coverage file must stay inside the worktree, must describe at least one file, and cannot exceed 64 MiB. Import requires an online agent that supports coverage imports.
Changed-line coverage is measured against the worktree's base branch. If the branch or its remote reference cannot be resolved, the import still keeps whole-file coverage, but the changed-file breakdown and line overlay are unavailable.
## Related pages
Where an Xcode coverage report is generated, alongside logs, artifacts, and test results.
The same report, overlaid line by line on the branch's diff.
Worktree coverage reports, which measure the lines changed in a branch and its working tree.