> ## Documentation Index
> Fetch the complete documentation index at: https://ai-development-environment.mintlify.site/llms.txt
> Use this file to discover all available pages before exploring further.
# Analytics Events
> Inspect product analytics events and their parameters as they arrive.
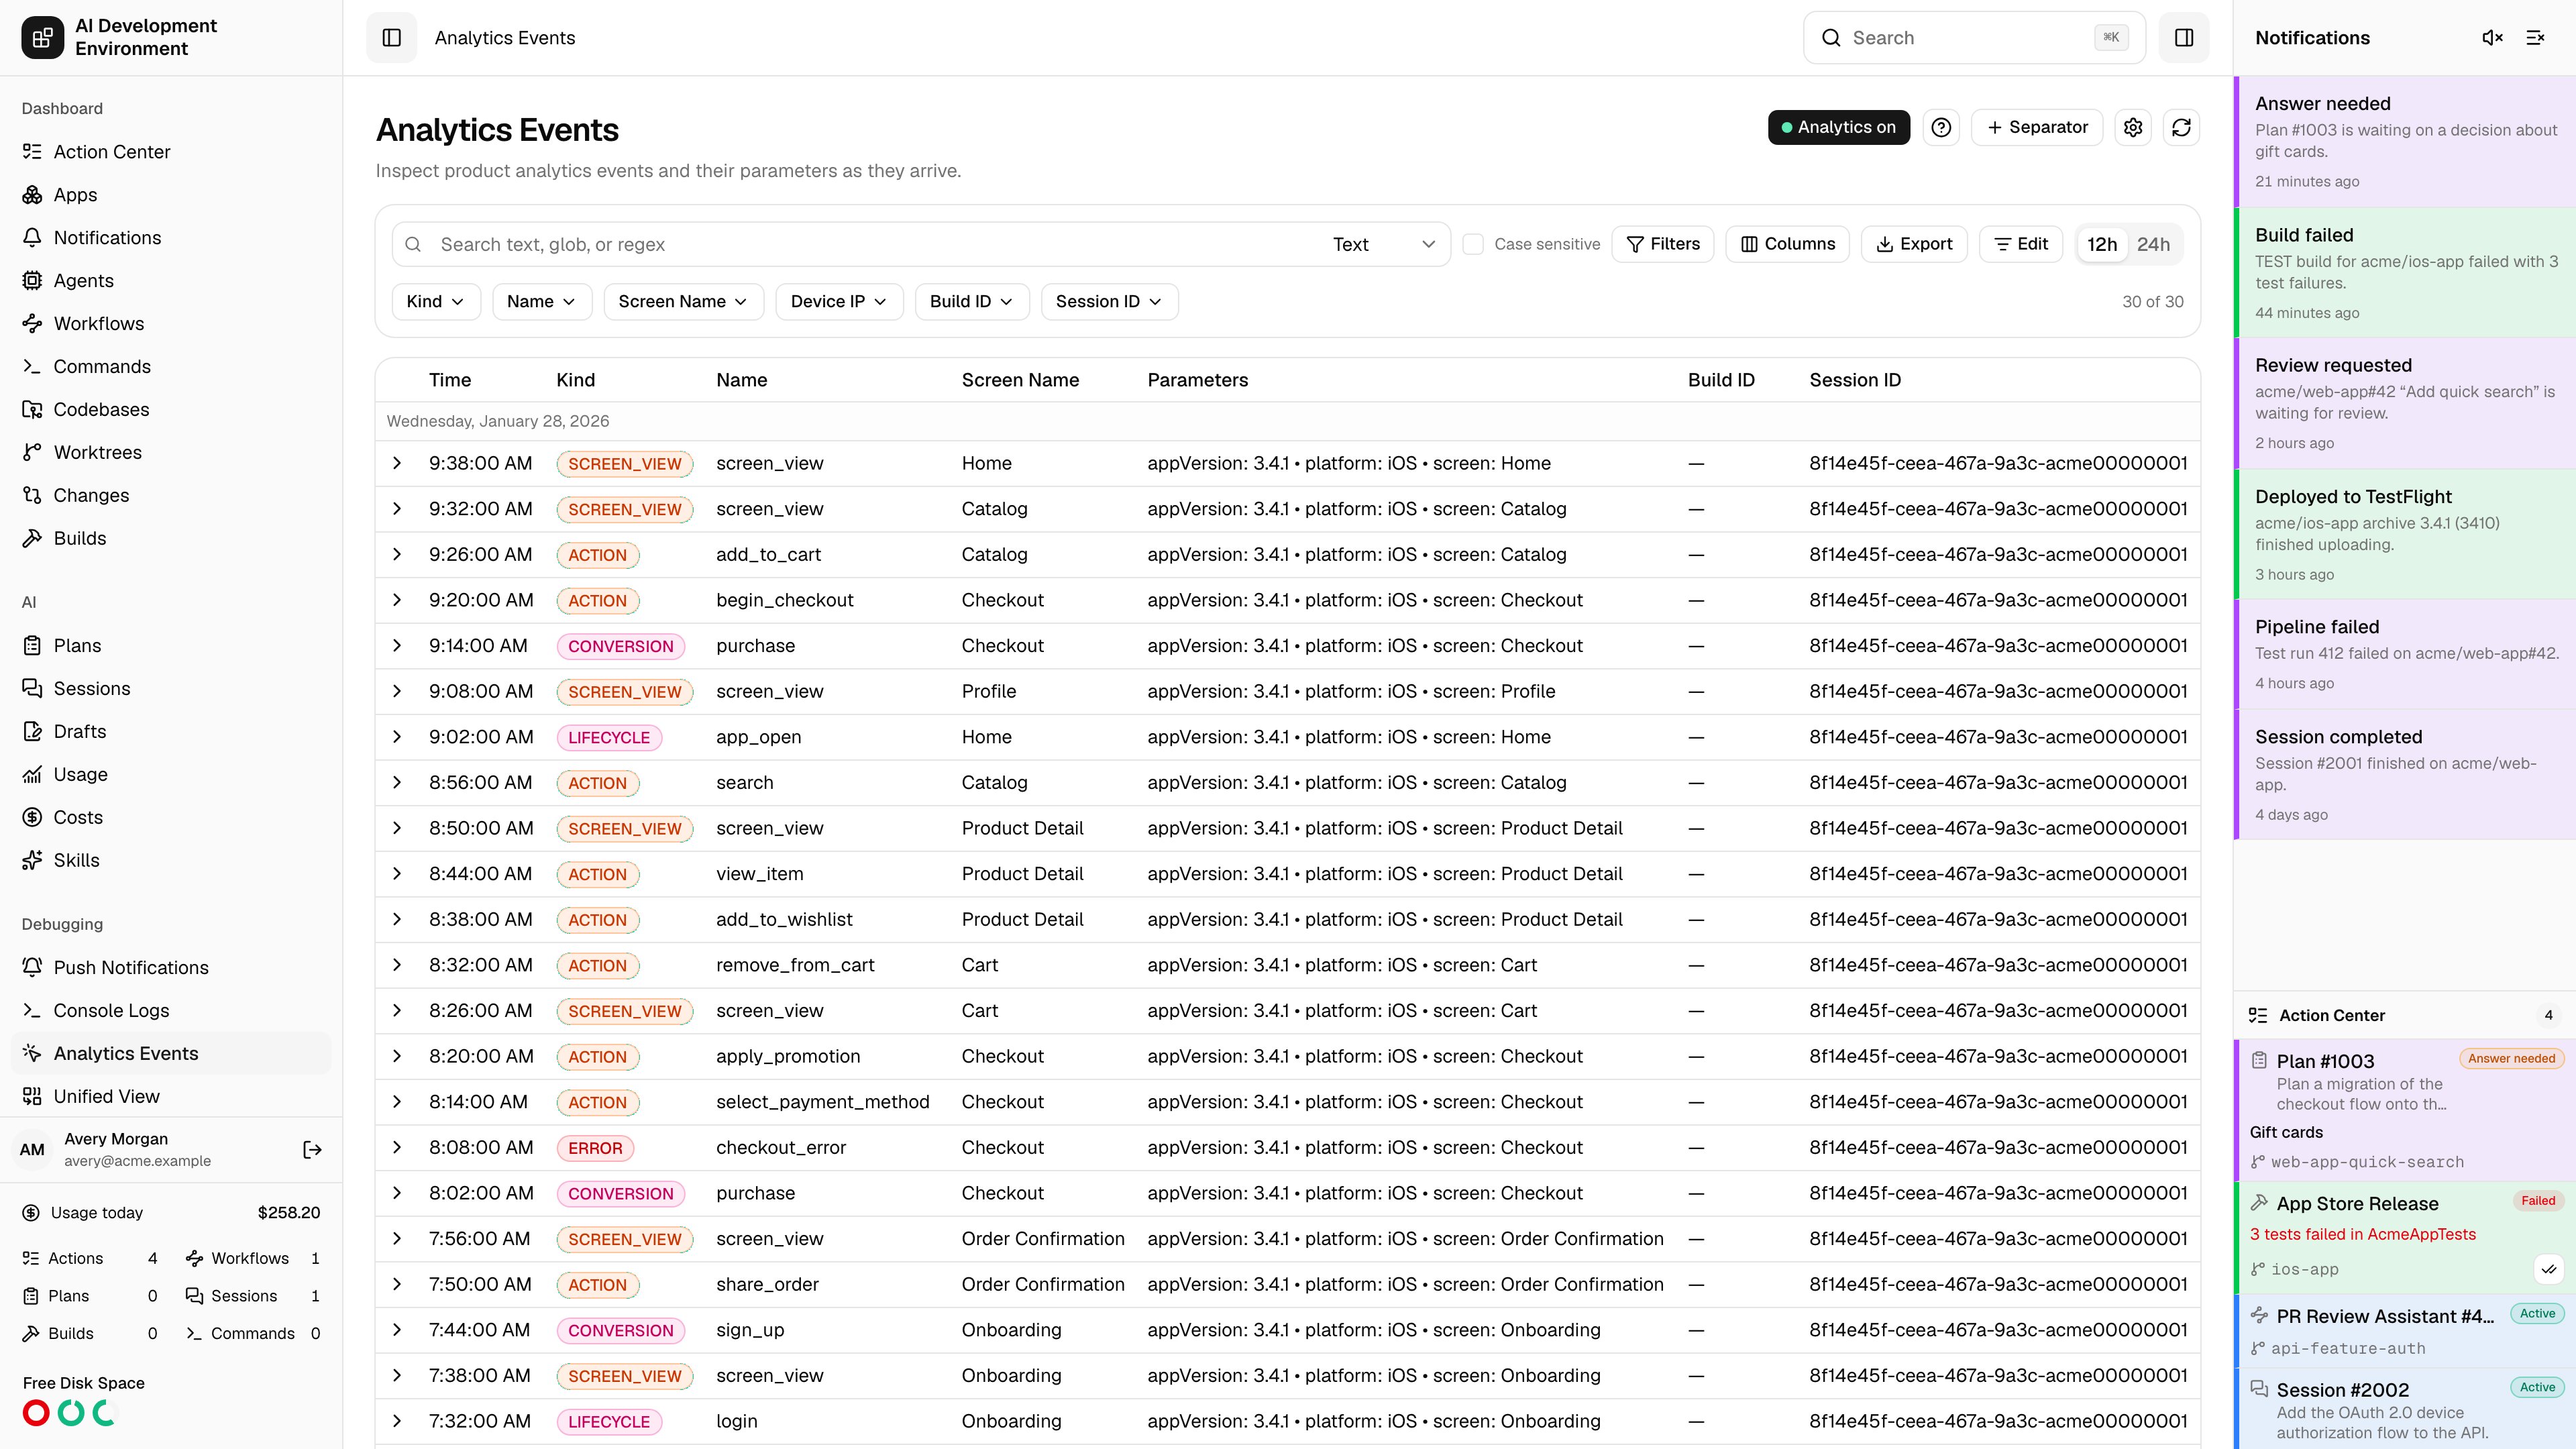
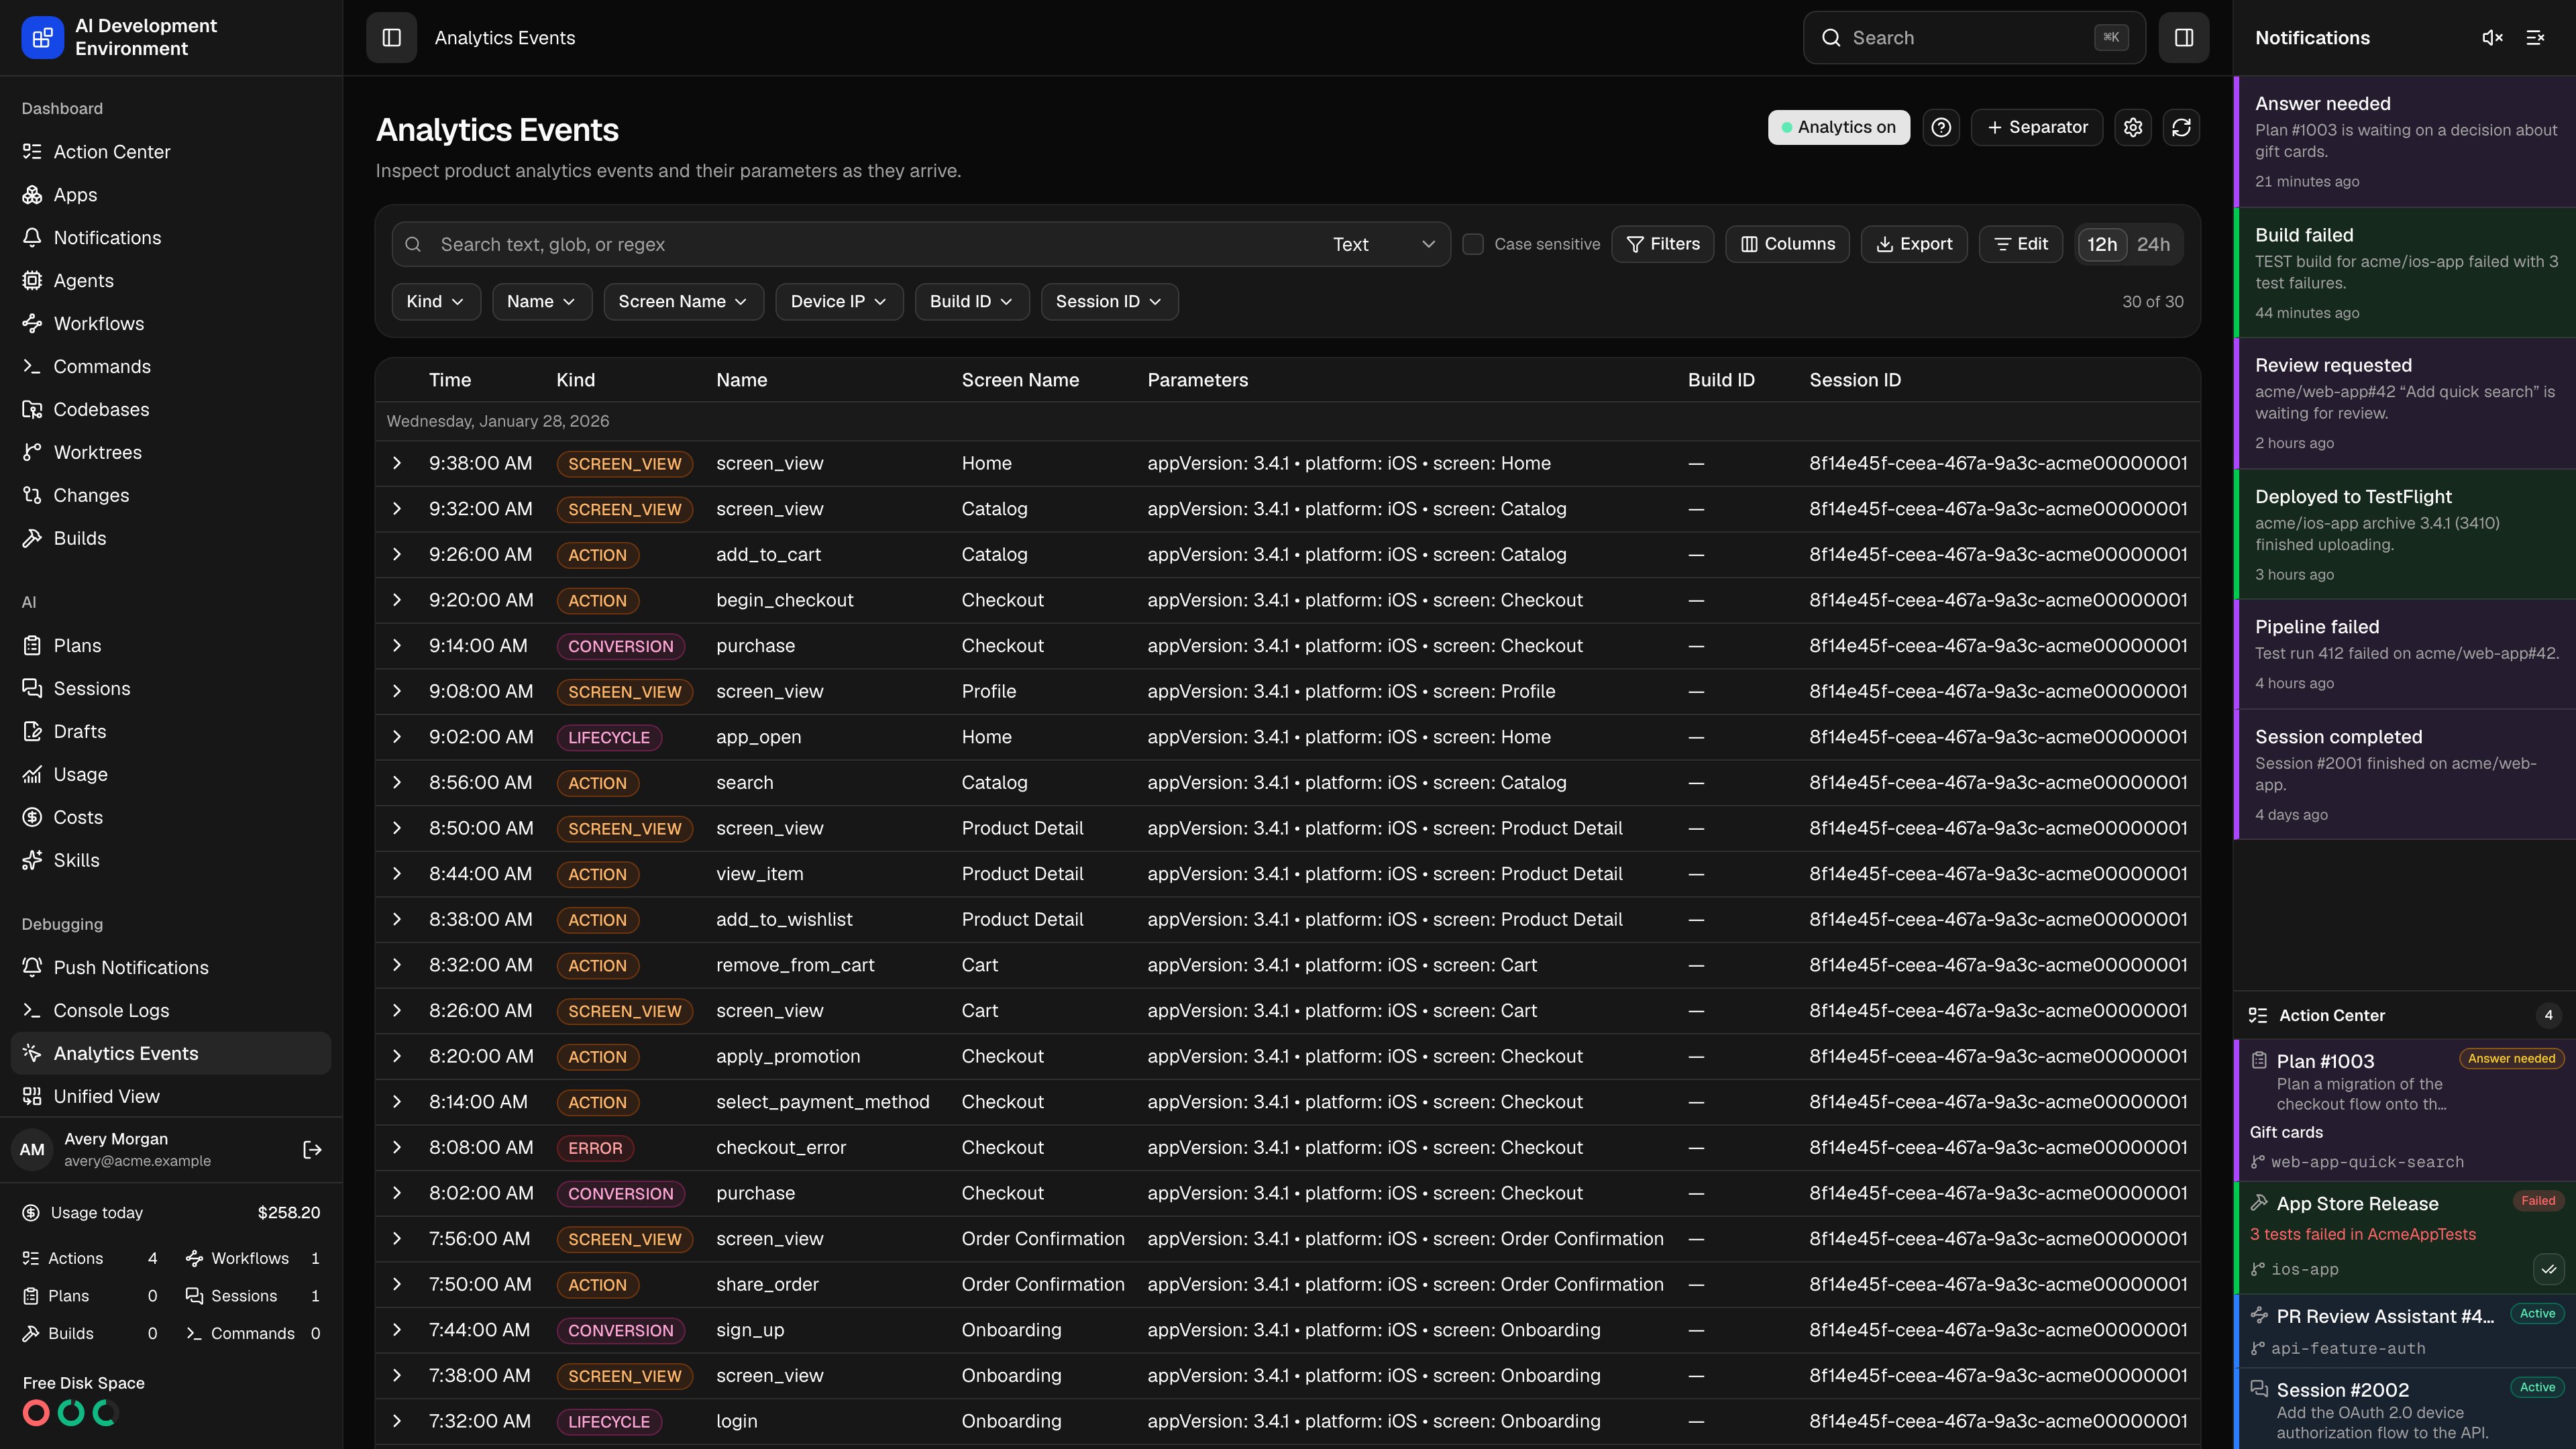 The **Analytics Events** page at `/analytics-events` is where you verify product instrumentation before it reaches a real analytics provider. Your app posts the same events it would send to its analytics SDK to a REST endpoint here, and the page shows each one as it arrives — event name, screen, and every parameter — so you can confirm that a tap fires the event you expect, with the payload you expect, on the build you are holding.
It shares its timeline, settings, and ingestion model with [Console Logs](/debugging/console-logs); the [Unified View](/debugging/unified-events) interleaves both.
## What an analytics record contains
| Field | Sent by | Notes |
| ---------------------- | -------- | ----------------------------------------------------------- |
| `eventName` | Your app | The event identifier, up to 256 characters |
| `kind` | Your app | Your own classification — `product`, `diagnostic`, anything |
| `screenName` | Your app | Where the event happened |
| `time` | Your app | ISO-8601 with `Z` or an explicit UTC offset |
| `defaultParameters` | Your app | The context your SDK attaches to every event |
| `additionalParameters` | Your app | Parameters specific to this event |
| `buildId` | Your app | Ties the event back to a build |
| `sessionId` | Your app | Ties events from one app launch together |
| `receivedAt` | Server | When the control plane accepted the record |
| `deviceIp` | Server | Resolved from the request |
| `id` | Server | A UUID |
The split between `defaultParameters` and `additionalParameters` mirrors how most analytics SDKs work: a global context bag merged with per-event properties. Keeping them separate here lets you see, at a glance, whether a missing value was dropped from the global context or never attached to the event.
## Parameters are first-class fields
Both parameter dictionaries are flattened into dotted paths and indexed. An event carrying `additionalParameters: {"cart": {"items": 3}}` gains the field `additionalParameters.cart.items`, and that path is immediately:
* matched by search,
* selectable in the **Filters** sheet,
* addable as a table column,
* selectable as an export field.
Keys that are not safe identifiers are bracketed instead — `additionalParameters["checkout step"]`. In the table and in menus the prefix is stripped, so the column simply reads `cart.items`.
Clicking a row shows the event name and screen, a metadata grid — time, received, device IP, build ID, session ID, kind, name, screen — and two dictionary blocks side by side: **Default Parameters** and **Additional Parameters**.
Click the **+** beside any path to add it as a column. Click the funnel to filter the timeline to that exact value.
Right-click a parameter row for **Copy ``: value** or **Copy value**; right-click a whole block for **Copy JSON dictionary** or **Copy path: values**.
## Columns
The default columns are **Time**, **Kind**, **Name**, **Screen Name**, **Parameters**, **Build ID**, and **Session ID**. **Device IP**, **Received**, **Default Parameters**, and **Additional Parameters** are also available, plus every parameter path discovered in the stored events.
The **Parameters** column is a summary: every flattened path from both dictionaries, rendered as `key: value` pairs separated by bullets and clamped to three lines. It is the fastest way to eyeball payloads without expanding rows — but for a value you check often, promote that path to its own column and sort your eyes down a single narrow column instead.
Save a layout as a preset, mark one preset as the default for this view, or **Reset columns** to return to the shipped set. The **12h** / **24h** toggle applies to the table and to exports.
## Searching and filtering
Search runs in **Text**, **Glob**, or **Regex** (RE2) mode with an independent **Case sensitive** toggle, and it covers field names and values — including every parameter path.
Quick filters on this view are **Kind**, **Name**, **Screen Name**, **Device IP**, **Build ID**, and **Session ID**, each populated from the values actually present in stored events. Selecting several values in one dropdown matches any of them; selections across dropdowns must all match.
**Filters** opens the advanced sheet, where any field — standard or parameter path — can be combined with **contains**, **does not contain**, **is**, **is not**, **matches glob**, **matches regex**, **no regex match**, **is empty**, or **is not empty**, joined by **All conditions** or **Any condition**. Name a set of conditions to save it; saved filters and column presets are scoped to this view.
**is empty** is the instrumentation check worth remembering: filter to `additionalParameters.cart.items` **is empty** to find every event where the parameter you expected never arrived.
## Reading the timeline
Events load newest first, 200 at a time, with **Load more** at the bottom and a *matching of total* counter above the table. Rows are grouped by local day, new arrivals flash on ingestion, and separators — manual ones you add with **+ Separator**, and the `Build · · ` markers created automatically when a build starts — are shared with the other views.
Each expanded event offers a 19-color **Highlight** strip that tints the row for everyone using the app, and a **Delete** button for that single event.
## Editing, clearing, and exporting
**Edit** turns on selection. Select rows individually, by day, by separator, or **Select all matching rows** to take the whole filtered result set. Then **Clear selected**, **Clear all** — which asks whether to keep separators and ignores active filters — or **Clear before latest separator**.
Clearing is permanent. **Clear all** on this view removes every analytics event, regardless of what the current filters show.
**Export** produces **CSV**, **Markdown**, or **PDF** from the selection, or from everything matching the current search and filters. Choose up to 30 fields — parameter paths included — and the file downloads as `observability-.` with your locale, time zone, and time format applied.
## Collection and endpoints
The header button reading **Analytics on** or **Analytics off** controls ingestion for analytics events only; console collection has its own switch. While it is off, the endpoint still validates payloads and answers `202 Accepted` without storing anything, so instrumented clients never see errors.
The gear icon opens the shared **Observability settings**, where the local and remote base URLs are detected or overridden and every endpoint is copyable. See [Console Logs](/debugging/console-logs) for how those origins are resolved and handed to build scripts.
## Sending analytics events
The **?** icon opens **Send analytics events**, which renders the contract against your configured origins with a **Copy Markdown docs** button.
Send one event, or an atomic batch as `{ "items": [...] }` with up to 500 events. The endpoint is unauthenticated, `Content-Type` must be `application/json`, and the body is capped at 2 MiB.
```bash theme={null}
curl --request POST 'http://127.0.0.1:3000/api/telemetry/analytics-events' \
--header 'content-type: application/json' \
--data '{
"eventName": "checkout_completed",
"kind": "product",
"screenName": "Checkout",
"time": "2026-07-20T18:30:00.000Z",
"defaultParameters": { "appVersion": "1.0", "platform": "iOS" },
"additionalParameters": { "cartItems": 3, "coupon": "SUMMER" },
"buildId": "build-123",
"sessionId": "session-456"
}'
```
### Validation rules
All eight fields are required — send `{}` for a parameter dictionary you are not using rather than omitting it. Unknown fields are rejected; server-owned fields such as `id`, `receivedAt`, and `deviceIp` may be present but are ignored.
| Rule | Limit |
| --------------------------------------------------------- | ------------------------------------------------- |
| `eventName`, `kind`, `screenName`, `buildId`, `sessionId` | 1–256 characters |
| `time` | ISO-8601 with `Z` or an offset; normalized to UTC |
| Parameter nesting | 10 levels per dictionary |
| Parameter paths | 500 per dictionary |
| Parameter size | 512 KiB serialized per dictionary |
| String values inside parameters | 256 characters |
### Responses
| Status | Meaning |
| ------ | ------------------------------------------------------------------------- |
| `201` | Events collected — the body lists each `id`, `receivedAt`, and `deviceIp` |
| `202` | Payload valid, but analytics collection is off; nothing was stored |
| `400` | Malformed or invalid payload — the body names the offending field |
| `413` | Body exceeds 2 MiB |
| `415` | `Content-Type` is not `application/json` |
| `500` | Server error |
## Live updates
The page subscribes to telemetry changes: events appear as they are ingested, highlights and deletions made in another browser apply in place, and settings changed elsewhere refresh the toolbar without a reload.
## Related pages
Structured console output, the full ingestion contract, and shared settings.
Analytics events interleaved with the console output around them.
Build scripts that receive the ingestion endpoints for each destination.
Query the same timeline from a script with `telemetryTimeline`.
The **Analytics Events** page at `/analytics-events` is where you verify product instrumentation before it reaches a real analytics provider. Your app posts the same events it would send to its analytics SDK to a REST endpoint here, and the page shows each one as it arrives — event name, screen, and every parameter — so you can confirm that a tap fires the event you expect, with the payload you expect, on the build you are holding.
It shares its timeline, settings, and ingestion model with [Console Logs](/debugging/console-logs); the [Unified View](/debugging/unified-events) interleaves both.
## What an analytics record contains
| Field | Sent by | Notes |
| ---------------------- | -------- | ----------------------------------------------------------- |
| `eventName` | Your app | The event identifier, up to 256 characters |
| `kind` | Your app | Your own classification — `product`, `diagnostic`, anything |
| `screenName` | Your app | Where the event happened |
| `time` | Your app | ISO-8601 with `Z` or an explicit UTC offset |
| `defaultParameters` | Your app | The context your SDK attaches to every event |
| `additionalParameters` | Your app | Parameters specific to this event |
| `buildId` | Your app | Ties the event back to a build |
| `sessionId` | Your app | Ties events from one app launch together |
| `receivedAt` | Server | When the control plane accepted the record |
| `deviceIp` | Server | Resolved from the request |
| `id` | Server | A UUID |
The split between `defaultParameters` and `additionalParameters` mirrors how most analytics SDKs work: a global context bag merged with per-event properties. Keeping them separate here lets you see, at a glance, whether a missing value was dropped from the global context or never attached to the event.
## Parameters are first-class fields
Both parameter dictionaries are flattened into dotted paths and indexed. An event carrying `additionalParameters: {"cart": {"items": 3}}` gains the field `additionalParameters.cart.items`, and that path is immediately:
* matched by search,
* selectable in the **Filters** sheet,
* addable as a table column,
* selectable as an export field.
Keys that are not safe identifiers are bracketed instead — `additionalParameters["checkout step"]`. In the table and in menus the prefix is stripped, so the column simply reads `cart.items`.
Clicking a row shows the event name and screen, a metadata grid — time, received, device IP, build ID, session ID, kind, name, screen — and two dictionary blocks side by side: **Default Parameters** and **Additional Parameters**.
Click the **+** beside any path to add it as a column. Click the funnel to filter the timeline to that exact value.
Right-click a parameter row for **Copy ``: value** or **Copy value**; right-click a whole block for **Copy JSON dictionary** or **Copy path: values**.
## Columns
The default columns are **Time**, **Kind**, **Name**, **Screen Name**, **Parameters**, **Build ID**, and **Session ID**. **Device IP**, **Received**, **Default Parameters**, and **Additional Parameters** are also available, plus every parameter path discovered in the stored events.
The **Parameters** column is a summary: every flattened path from both dictionaries, rendered as `key: value` pairs separated by bullets and clamped to three lines. It is the fastest way to eyeball payloads without expanding rows — but for a value you check often, promote that path to its own column and sort your eyes down a single narrow column instead.
Save a layout as a preset, mark one preset as the default for this view, or **Reset columns** to return to the shipped set. The **12h** / **24h** toggle applies to the table and to exports.
## Searching and filtering
Search runs in **Text**, **Glob**, or **Regex** (RE2) mode with an independent **Case sensitive** toggle, and it covers field names and values — including every parameter path.
Quick filters on this view are **Kind**, **Name**, **Screen Name**, **Device IP**, **Build ID**, and **Session ID**, each populated from the values actually present in stored events. Selecting several values in one dropdown matches any of them; selections across dropdowns must all match.
**Filters** opens the advanced sheet, where any field — standard or parameter path — can be combined with **contains**, **does not contain**, **is**, **is not**, **matches glob**, **matches regex**, **no regex match**, **is empty**, or **is not empty**, joined by **All conditions** or **Any condition**. Name a set of conditions to save it; saved filters and column presets are scoped to this view.
**is empty** is the instrumentation check worth remembering: filter to `additionalParameters.cart.items` **is empty** to find every event where the parameter you expected never arrived.
## Reading the timeline
Events load newest first, 200 at a time, with **Load more** at the bottom and a *matching of total* counter above the table. Rows are grouped by local day, new arrivals flash on ingestion, and separators — manual ones you add with **+ Separator**, and the `Build · · ` markers created automatically when a build starts — are shared with the other views.
Each expanded event offers a 19-color **Highlight** strip that tints the row for everyone using the app, and a **Delete** button for that single event.
## Editing, clearing, and exporting
**Edit** turns on selection. Select rows individually, by day, by separator, or **Select all matching rows** to take the whole filtered result set. Then **Clear selected**, **Clear all** — which asks whether to keep separators and ignores active filters — or **Clear before latest separator**.
Clearing is permanent. **Clear all** on this view removes every analytics event, regardless of what the current filters show.
**Export** produces **CSV**, **Markdown**, or **PDF** from the selection, or from everything matching the current search and filters. Choose up to 30 fields — parameter paths included — and the file downloads as `observability-.` with your locale, time zone, and time format applied.
## Collection and endpoints
The header button reading **Analytics on** or **Analytics off** controls ingestion for analytics events only; console collection has its own switch. While it is off, the endpoint still validates payloads and answers `202 Accepted` without storing anything, so instrumented clients never see errors.
The gear icon opens the shared **Observability settings**, where the local and remote base URLs are detected or overridden and every endpoint is copyable. See [Console Logs](/debugging/console-logs) for how those origins are resolved and handed to build scripts.
## Sending analytics events
The **?** icon opens **Send analytics events**, which renders the contract against your configured origins with a **Copy Markdown docs** button.
Send one event, or an atomic batch as `{ "items": [...] }` with up to 500 events. The endpoint is unauthenticated, `Content-Type` must be `application/json`, and the body is capped at 2 MiB.
```bash theme={null}
curl --request POST 'http://127.0.0.1:3000/api/telemetry/analytics-events' \
--header 'content-type: application/json' \
--data '{
"eventName": "checkout_completed",
"kind": "product",
"screenName": "Checkout",
"time": "2026-07-20T18:30:00.000Z",
"defaultParameters": { "appVersion": "1.0", "platform": "iOS" },
"additionalParameters": { "cartItems": 3, "coupon": "SUMMER" },
"buildId": "build-123",
"sessionId": "session-456"
}'
```
### Validation rules
All eight fields are required — send `{}` for a parameter dictionary you are not using rather than omitting it. Unknown fields are rejected; server-owned fields such as `id`, `receivedAt`, and `deviceIp` may be present but are ignored.
| Rule | Limit |
| --------------------------------------------------------- | ------------------------------------------------- |
| `eventName`, `kind`, `screenName`, `buildId`, `sessionId` | 1–256 characters |
| `time` | ISO-8601 with `Z` or an offset; normalized to UTC |
| Parameter nesting | 10 levels per dictionary |
| Parameter paths | 500 per dictionary |
| Parameter size | 512 KiB serialized per dictionary |
| String values inside parameters | 256 characters |
### Responses
| Status | Meaning |
| ------ | ------------------------------------------------------------------------- |
| `201` | Events collected — the body lists each `id`, `receivedAt`, and `deviceIp` |
| `202` | Payload valid, but analytics collection is off; nothing was stored |
| `400` | Malformed or invalid payload — the body names the offending field |
| `413` | Body exceeds 2 MiB |
| `415` | `Content-Type` is not `application/json` |
| `500` | Server error |
## Live updates
The page subscribes to telemetry changes: events appear as they are ingested, highlights and deletions made in another browser apply in place, and settings changed elsewhere refresh the toolbar without a reload.
## Related pages
Structured console output, the full ingestion contract, and shared settings.
Analytics events interleaved with the console output around them.
Build scripts that receive the ingestion endpoints for each destination.
Query the same timeline from a script with `telemetryTimeline`.