> ## Documentation Index
> Fetch the complete documentation index at: https://ai-development-environment.mintlify.site/llms.txt
> Use this file to discover all available pages before exploring further.
# Unified View
> Review console logs and analytics events in one live timeline.
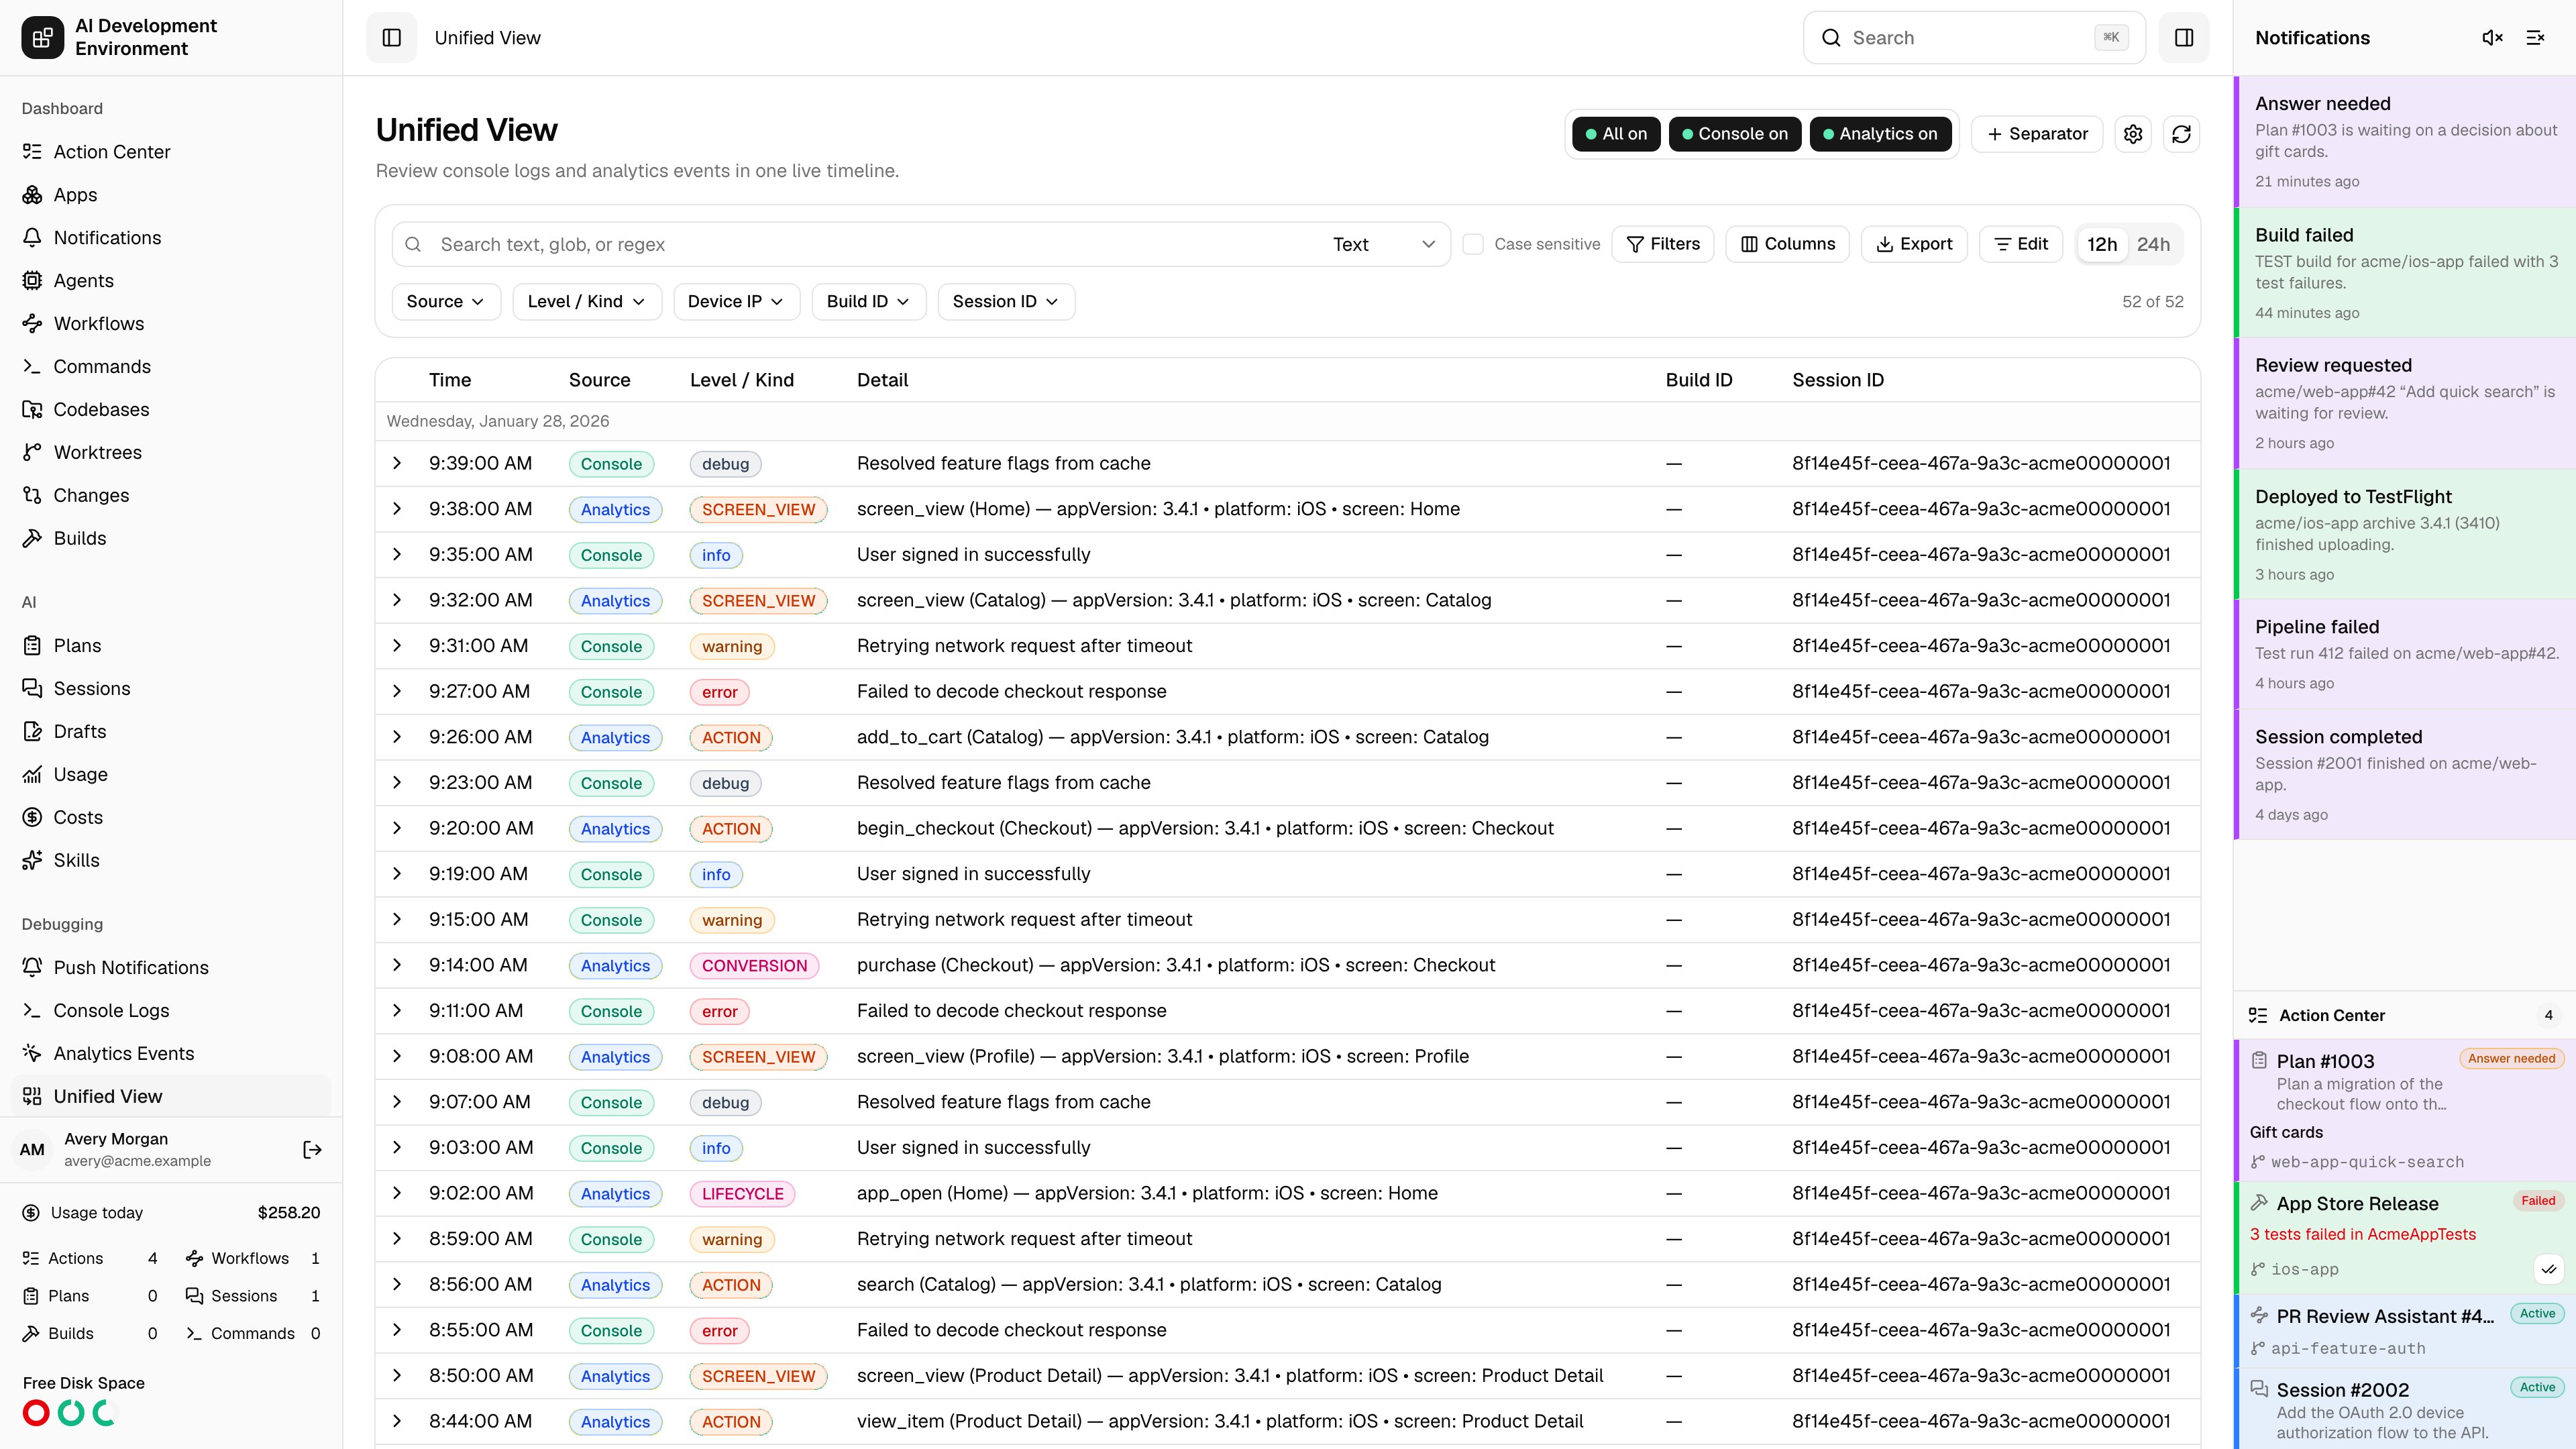
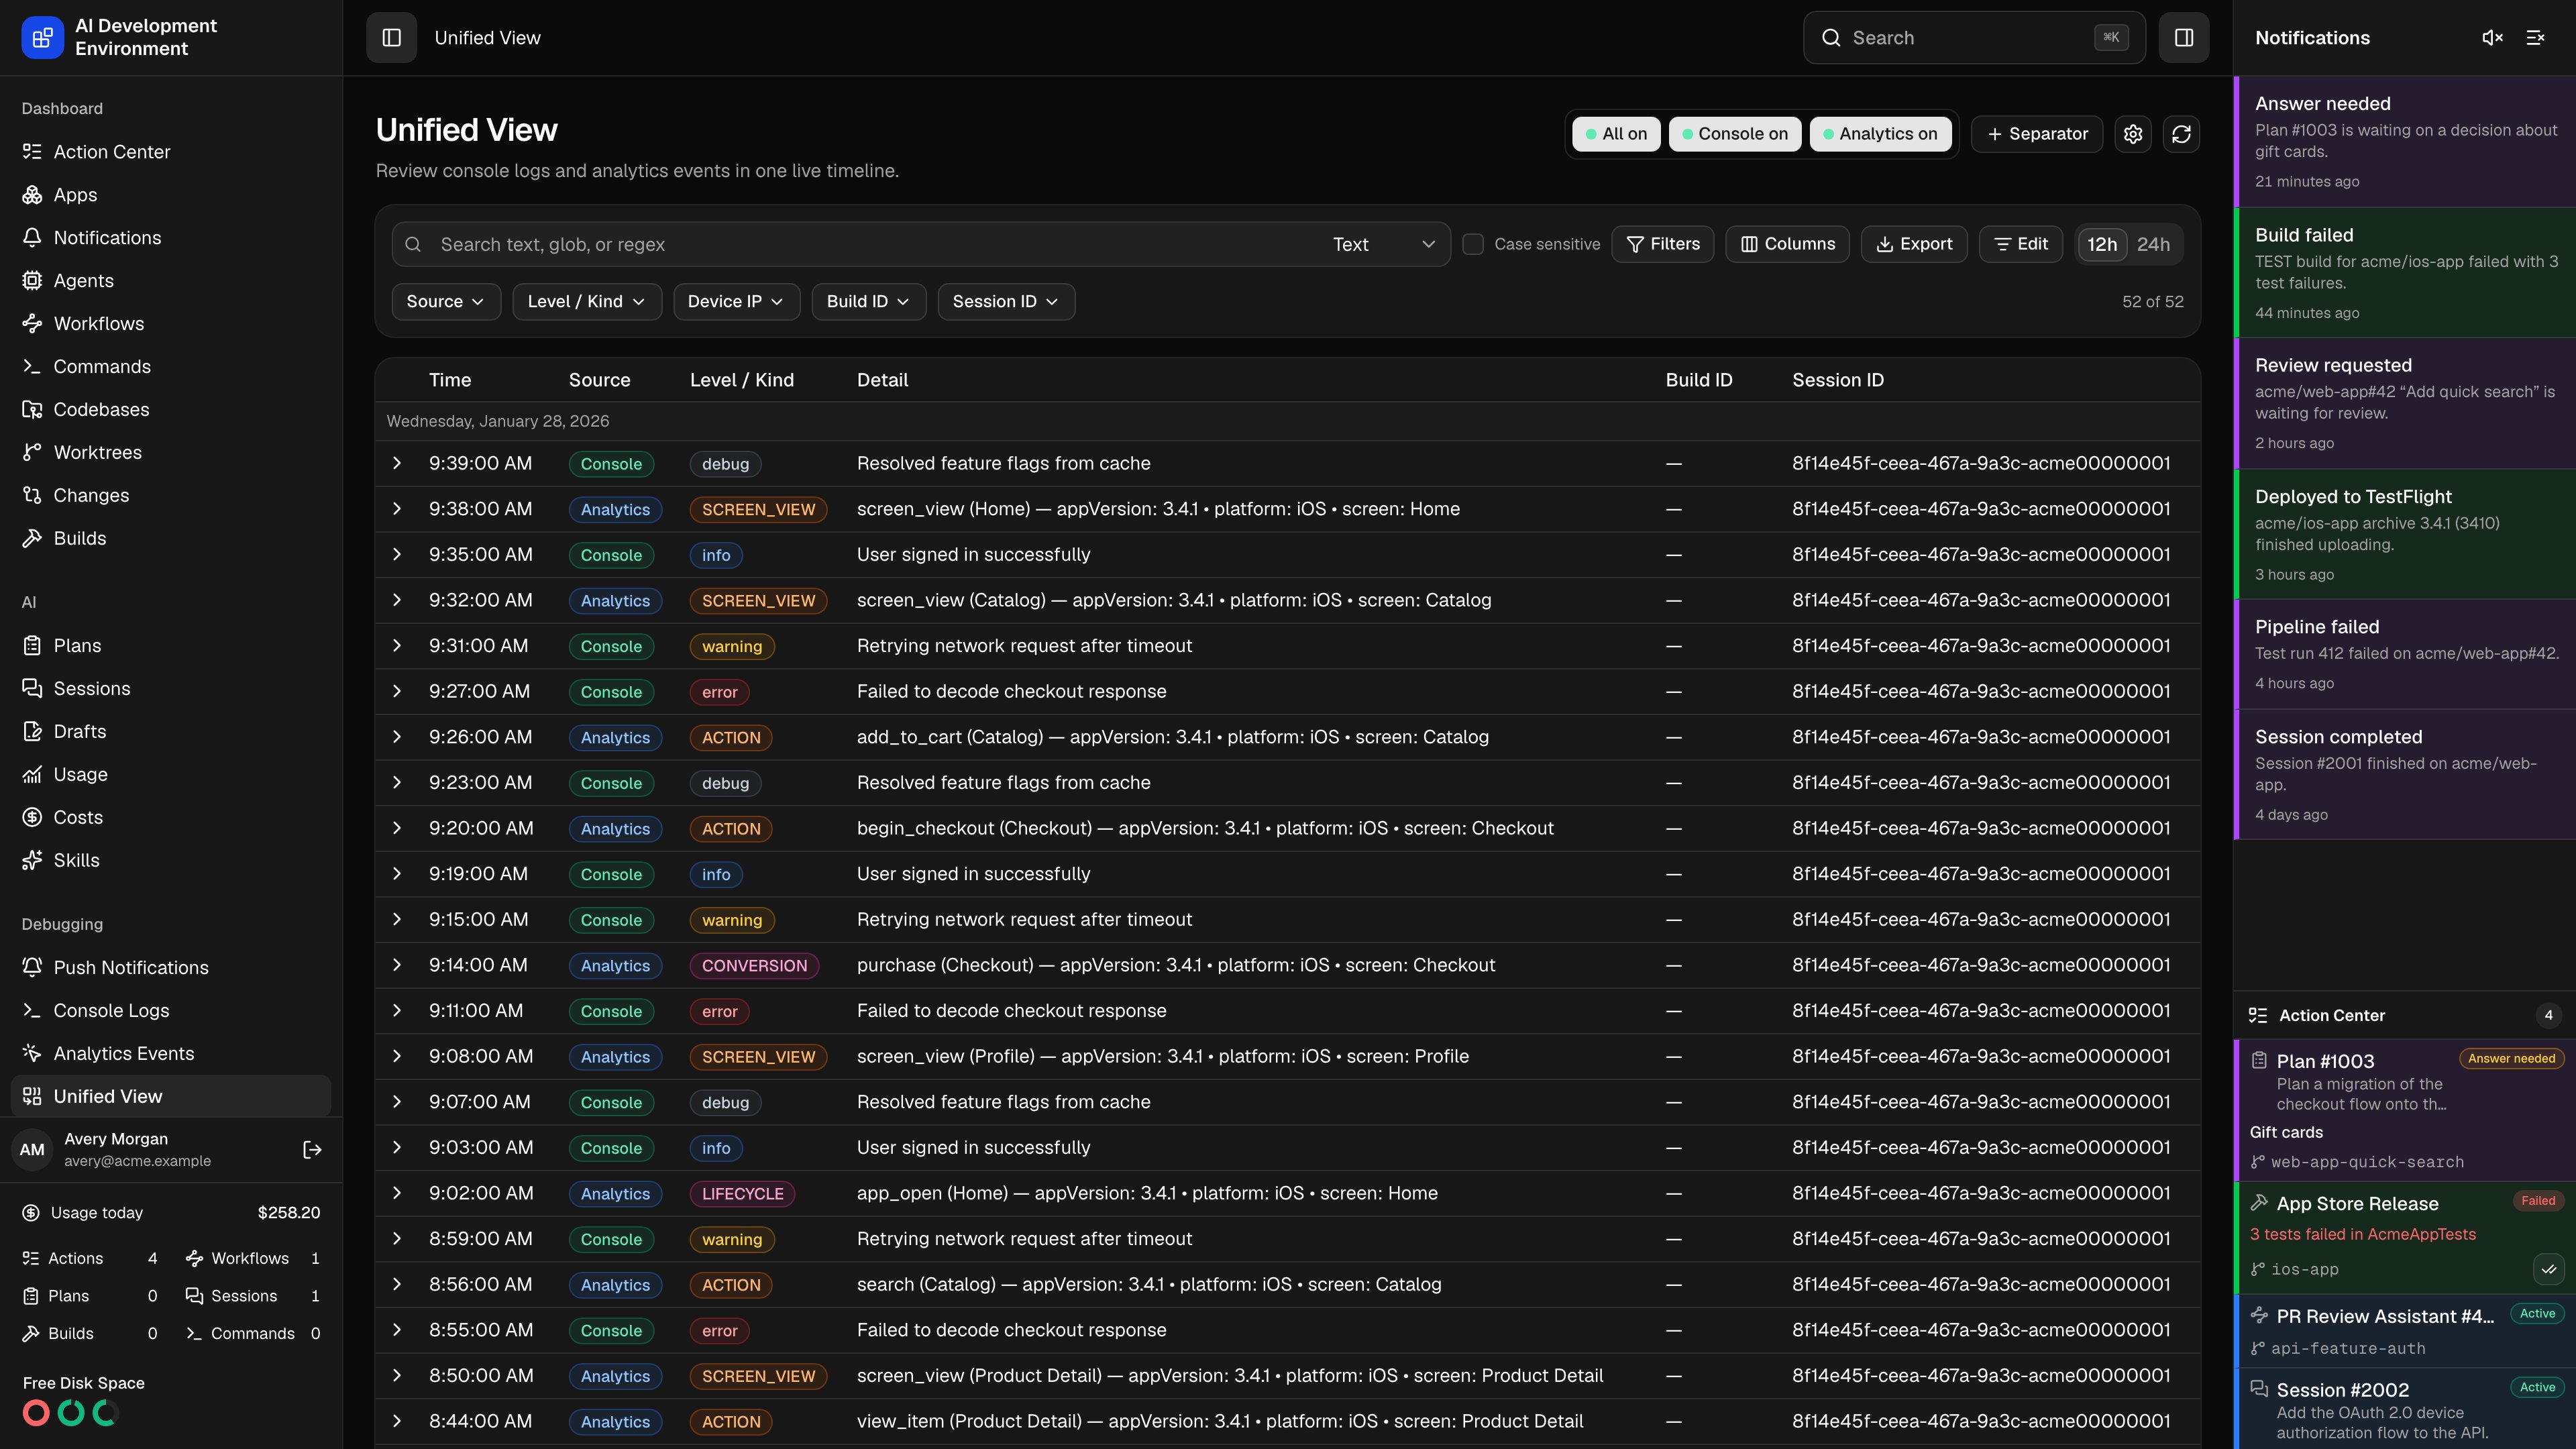 The **Unified View** page at `/unified-events` interleaves console logs and analytics events into one timeline ordered by client time. It answers the question the single-source views cannot: *what was the app printing when that event fired?*
[Console Logs](/debugging/console-logs) and [Analytics Events](/debugging/analytics-events) read the same underlying records. This page adds no new data — it adds the ordering, and a set of derived columns that make two differently shaped records readable in the same table.
## How the two sources line up
Console records and analytics records have different fields, so the unified table leads with three derived columns that resolve to whichever source a row came from.
| Column | Console row | Analytics row |
| ---------------- | -------------------- | ----------------------------------------------------------------- |
| **Source** | `Console` | `Analytics` |
| **Level / Kind** | The record's `level` | The event's `kind` |
| **Detail** | The full `message` | `eventName (screenName)` followed by a summary of every parameter |
The default layout is **Time**, **Source**, **Level / Kind**, **Detail**, **Build ID**, and **Session ID**. **Device IP**, **Received**, **Category**, and **Screen Name** are available too — they simply render empty on rows from the source that does not have them — as is every attribute and parameter path discovered in the stored records.
Build ID and session ID are the fields both sources share. Filter by `sessionId` to reconstruct a single app launch end to end: every log line and every event, in the order they actually happened.
## Searching and filtering across sources
Search behaves as it does elsewhere — **Text**, **Glob**, or **Regex** (RE2) with an independent **Case sensitive** toggle — and it covers both record shapes at once, including flattened `attributes`, `defaultParameters`, and `additionalParameters` paths.
Quick filters here are the fields that make sense for a mixed timeline: **Source**, **Level / Kind**, **Device IP**, **Build ID**, and **Session ID**.
Advanced conditions gain one control that the single-source views do not use: **Applies to**. A condition can be limited to **Console**, to **Analytics**, or left applying to both.
A condition scoped to one source is skipped entirely for rows from the other source rather than failing them. So "`level` **is** `error` (Console only)" keeps all analytics events in view and narrows only the console side — which is usually what you want when you are looking for the events surrounding an error.
Saved filters and column presets on this page are stored separately from the ones on Console Logs and Analytics Events, so each view keeps its own working set.
## Reading the timeline
Rows load newest first, 200 at a time, with **Load more** at the bottom and a *matching of total* counter above the table.
* Rows are grouped under local-day headers.
* **Source** and **Level / Kind** render as colored badges, so console errors and analytics events are distinguishable at a glance.
* Expanding a row shows the shape belonging to that record: message plus **Attributes** for console rows, event name and screen plus **Default Parameters** and **Additional Parameters** for analytics rows.
* Right-click any cell for **Copy ``: value**, **Copy value**, or **Filter by value**; the **+** beside a parameter or attribute path promotes it to a column.
* Each expanded row offers the 19-color **Highlight** strip and a per-record **Delete**.
## Separators
Separators are the anchors that make a mixed timeline readable. They are shared across all three views, so one added here shows up on the other two.
| Kind | Created by |
| ---------- | --------------------------------------------------------------------------------------------------------------- |
| **Manual** | **+ Separator** in the page header, with an optional name |
| **Build** | Automatically when a build starts, named `Build · · ` and badged with the build ID |
Selecting a separator's checkbox in **Edit** mode selects every row between it and the next separator above — the cleanest way to grab exactly one build's worth of console output and events together.
## Editing and clearing
**Edit** turns on selection checkboxes and the destructive toolbar: **Clear selected**, **Clear all**, and **Clear before latest separator**.
Clearing from this view is scoped to both sources. **Clear all** here deletes every console record *and* every analytics event — with **Clear with separators** additionally removing the markers. Filters are ignored. Use **Clear selected** when you want a narrower cut.
## Exporting
**Export** produces **CSV**, **Markdown**, or **PDF** covering both sources. Choose up to 30 fields, including the derived **Source**, **Level / Kind**, and **Detail** columns and any attribute or parameter path. The file downloads as `observability-.` with your locale, time zone, and 12h/24h preference applied, and records the search and filters that produced it.
## Collection controls
Because this view spans both sources, the header shows a three-button group instead of a single switch.
| Button | Effect |
| ------------- | ----------------------------------------------------------- |
| **All** | Turns both console and analytics collection on, or both off |
| **Console** | Toggles console ingestion only |
| **Analytics** | Toggles analytics ingestion only |
These control *ingestion*, not what the table displays — they are the same switches exposed on the two single-source pages. While a source is off, its endpoint keeps validating payloads and answers `202 Accepted` without storing anything.
The gear icon opens the shared **Observability settings** for the local and remote base URLs. There is no API help button on this view; the ingestion contract is per source, on [Console Logs](/debugging/console-logs) and [Analytics Events](/debugging/analytics-events).
## Live updates
The page subscribes to telemetry changes and reconciles in place, so records from both sources appear as they are ingested, and highlights, deletions, and settings changes made elsewhere arrive without a reload.
## Related pages
The console-only view and the full REST ingestion contract.
The analytics-only view and its parameter dictionaries.
The build behind a build separator, with its own log stream.
Query the unified timeline with `telemetryTimeline(view: UNIFIED)`.
The **Unified View** page at `/unified-events` interleaves console logs and analytics events into one timeline ordered by client time. It answers the question the single-source views cannot: *what was the app printing when that event fired?*
[Console Logs](/debugging/console-logs) and [Analytics Events](/debugging/analytics-events) read the same underlying records. This page adds no new data — it adds the ordering, and a set of derived columns that make two differently shaped records readable in the same table.
## How the two sources line up
Console records and analytics records have different fields, so the unified table leads with three derived columns that resolve to whichever source a row came from.
| Column | Console row | Analytics row |
| ---------------- | -------------------- | ----------------------------------------------------------------- |
| **Source** | `Console` | `Analytics` |
| **Level / Kind** | The record's `level` | The event's `kind` |
| **Detail** | The full `message` | `eventName (screenName)` followed by a summary of every parameter |
The default layout is **Time**, **Source**, **Level / Kind**, **Detail**, **Build ID**, and **Session ID**. **Device IP**, **Received**, **Category**, and **Screen Name** are available too — they simply render empty on rows from the source that does not have them — as is every attribute and parameter path discovered in the stored records.
Build ID and session ID are the fields both sources share. Filter by `sessionId` to reconstruct a single app launch end to end: every log line and every event, in the order they actually happened.
## Searching and filtering across sources
Search behaves as it does elsewhere — **Text**, **Glob**, or **Regex** (RE2) with an independent **Case sensitive** toggle — and it covers both record shapes at once, including flattened `attributes`, `defaultParameters`, and `additionalParameters` paths.
Quick filters here are the fields that make sense for a mixed timeline: **Source**, **Level / Kind**, **Device IP**, **Build ID**, and **Session ID**.
Advanced conditions gain one control that the single-source views do not use: **Applies to**. A condition can be limited to **Console**, to **Analytics**, or left applying to both.
A condition scoped to one source is skipped entirely for rows from the other source rather than failing them. So "`level` **is** `error` (Console only)" keeps all analytics events in view and narrows only the console side — which is usually what you want when you are looking for the events surrounding an error.
Saved filters and column presets on this page are stored separately from the ones on Console Logs and Analytics Events, so each view keeps its own working set.
## Reading the timeline
Rows load newest first, 200 at a time, with **Load more** at the bottom and a *matching of total* counter above the table.
* Rows are grouped under local-day headers.
* **Source** and **Level / Kind** render as colored badges, so console errors and analytics events are distinguishable at a glance.
* Expanding a row shows the shape belonging to that record: message plus **Attributes** for console rows, event name and screen plus **Default Parameters** and **Additional Parameters** for analytics rows.
* Right-click any cell for **Copy ``: value**, **Copy value**, or **Filter by value**; the **+** beside a parameter or attribute path promotes it to a column.
* Each expanded row offers the 19-color **Highlight** strip and a per-record **Delete**.
## Separators
Separators are the anchors that make a mixed timeline readable. They are shared across all three views, so one added here shows up on the other two.
| Kind | Created by |
| ---------- | --------------------------------------------------------------------------------------------------------------- |
| **Manual** | **+ Separator** in the page header, with an optional name |
| **Build** | Automatically when a build starts, named `Build · · ` and badged with the build ID |
Selecting a separator's checkbox in **Edit** mode selects every row between it and the next separator above — the cleanest way to grab exactly one build's worth of console output and events together.
## Editing and clearing
**Edit** turns on selection checkboxes and the destructive toolbar: **Clear selected**, **Clear all**, and **Clear before latest separator**.
Clearing from this view is scoped to both sources. **Clear all** here deletes every console record *and* every analytics event — with **Clear with separators** additionally removing the markers. Filters are ignored. Use **Clear selected** when you want a narrower cut.
## Exporting
**Export** produces **CSV**, **Markdown**, or **PDF** covering both sources. Choose up to 30 fields, including the derived **Source**, **Level / Kind**, and **Detail** columns and any attribute or parameter path. The file downloads as `observability-.` with your locale, time zone, and 12h/24h preference applied, and records the search and filters that produced it.
## Collection controls
Because this view spans both sources, the header shows a three-button group instead of a single switch.
| Button | Effect |
| ------------- | ----------------------------------------------------------- |
| **All** | Turns both console and analytics collection on, or both off |
| **Console** | Toggles console ingestion only |
| **Analytics** | Toggles analytics ingestion only |
These control *ingestion*, not what the table displays — they are the same switches exposed on the two single-source pages. While a source is off, its endpoint keeps validating payloads and answers `202 Accepted` without storing anything.
The gear icon opens the shared **Observability settings** for the local and remote base URLs. There is no API help button on this view; the ingestion contract is per source, on [Console Logs](/debugging/console-logs) and [Analytics Events](/debugging/analytics-events).
## Live updates
The page subscribes to telemetry changes and reconciles in place, so records from both sources appear as they are ingested, and highlights, deletions, and settings changes made elsewhere arrive without a reload.
## Related pages
The console-only view and the full REST ingestion contract.
The analytics-only view and its parameter dictionaries.
The build behind a build separator, with its own log stream.
Query the unified timeline with `telemetryTimeline(view: UNIFIED)`.