> ## Documentation Index
> Fetch the complete documentation index at: https://ai-development-environment.mintlify.site/llms.txt
> Use this file to discover all available pages before exploring further.
# Jira Cache
> Inspect cached Jira data, API usage, latency, and errors.
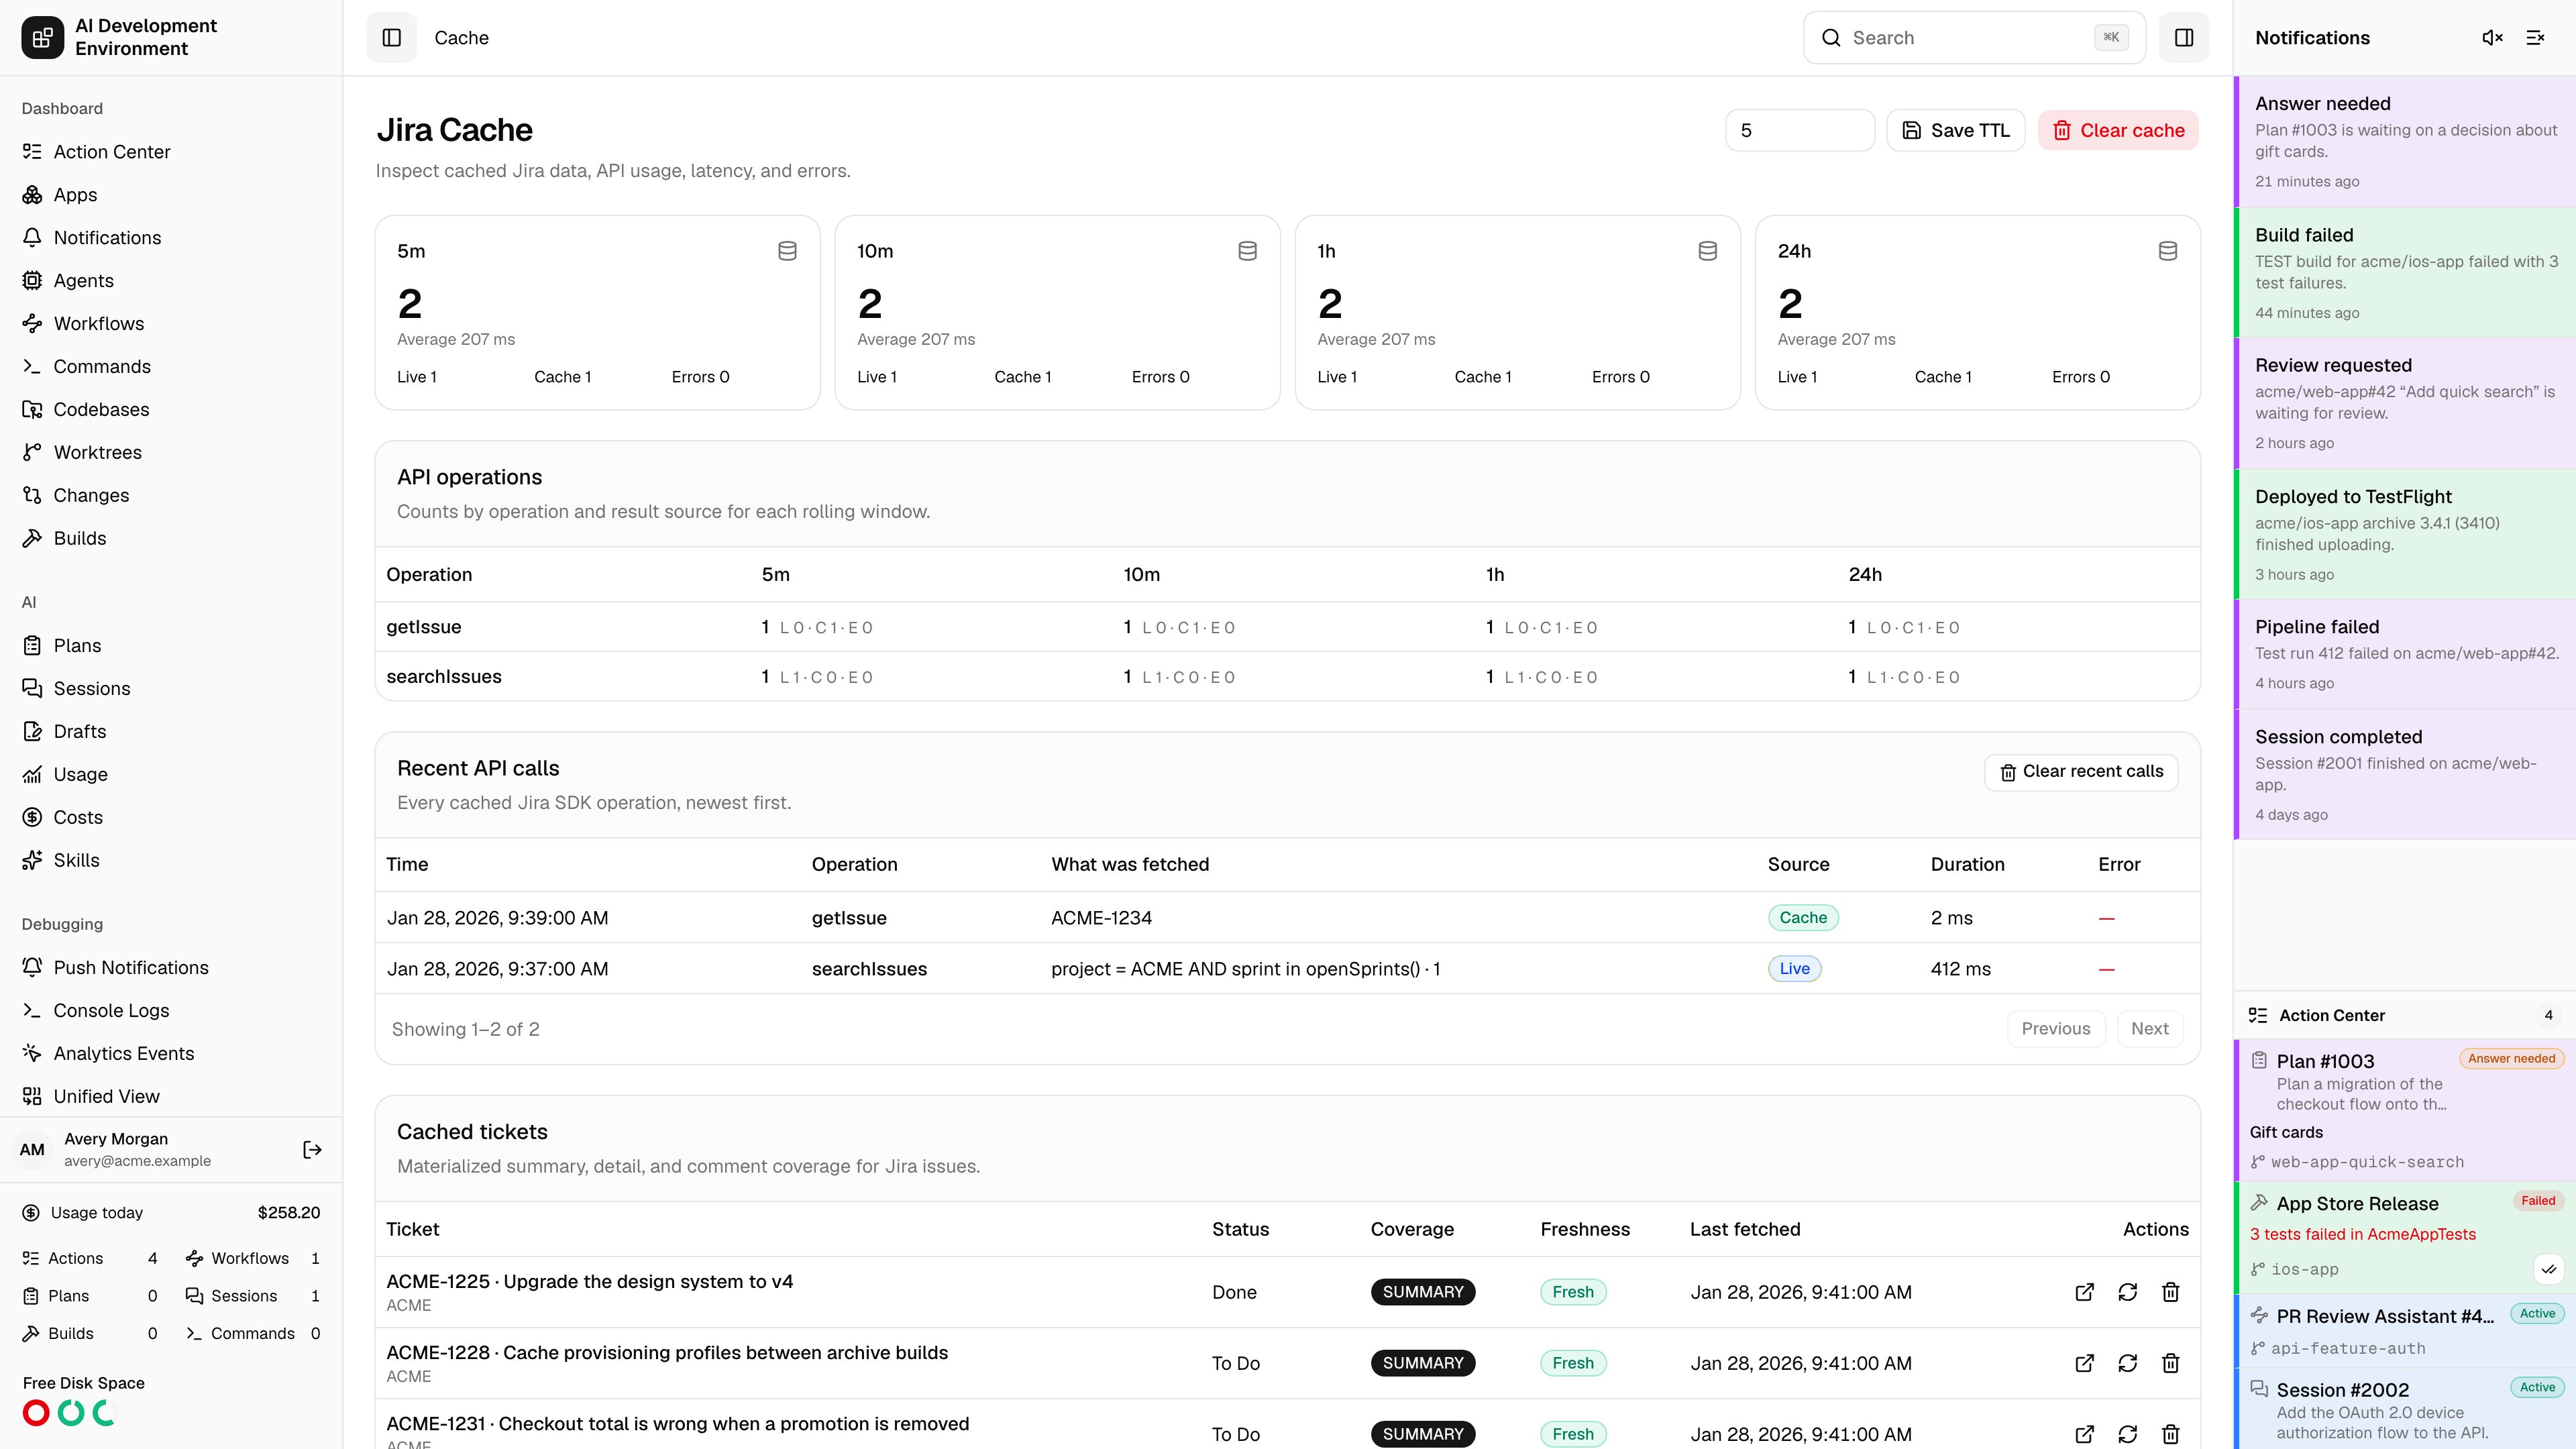
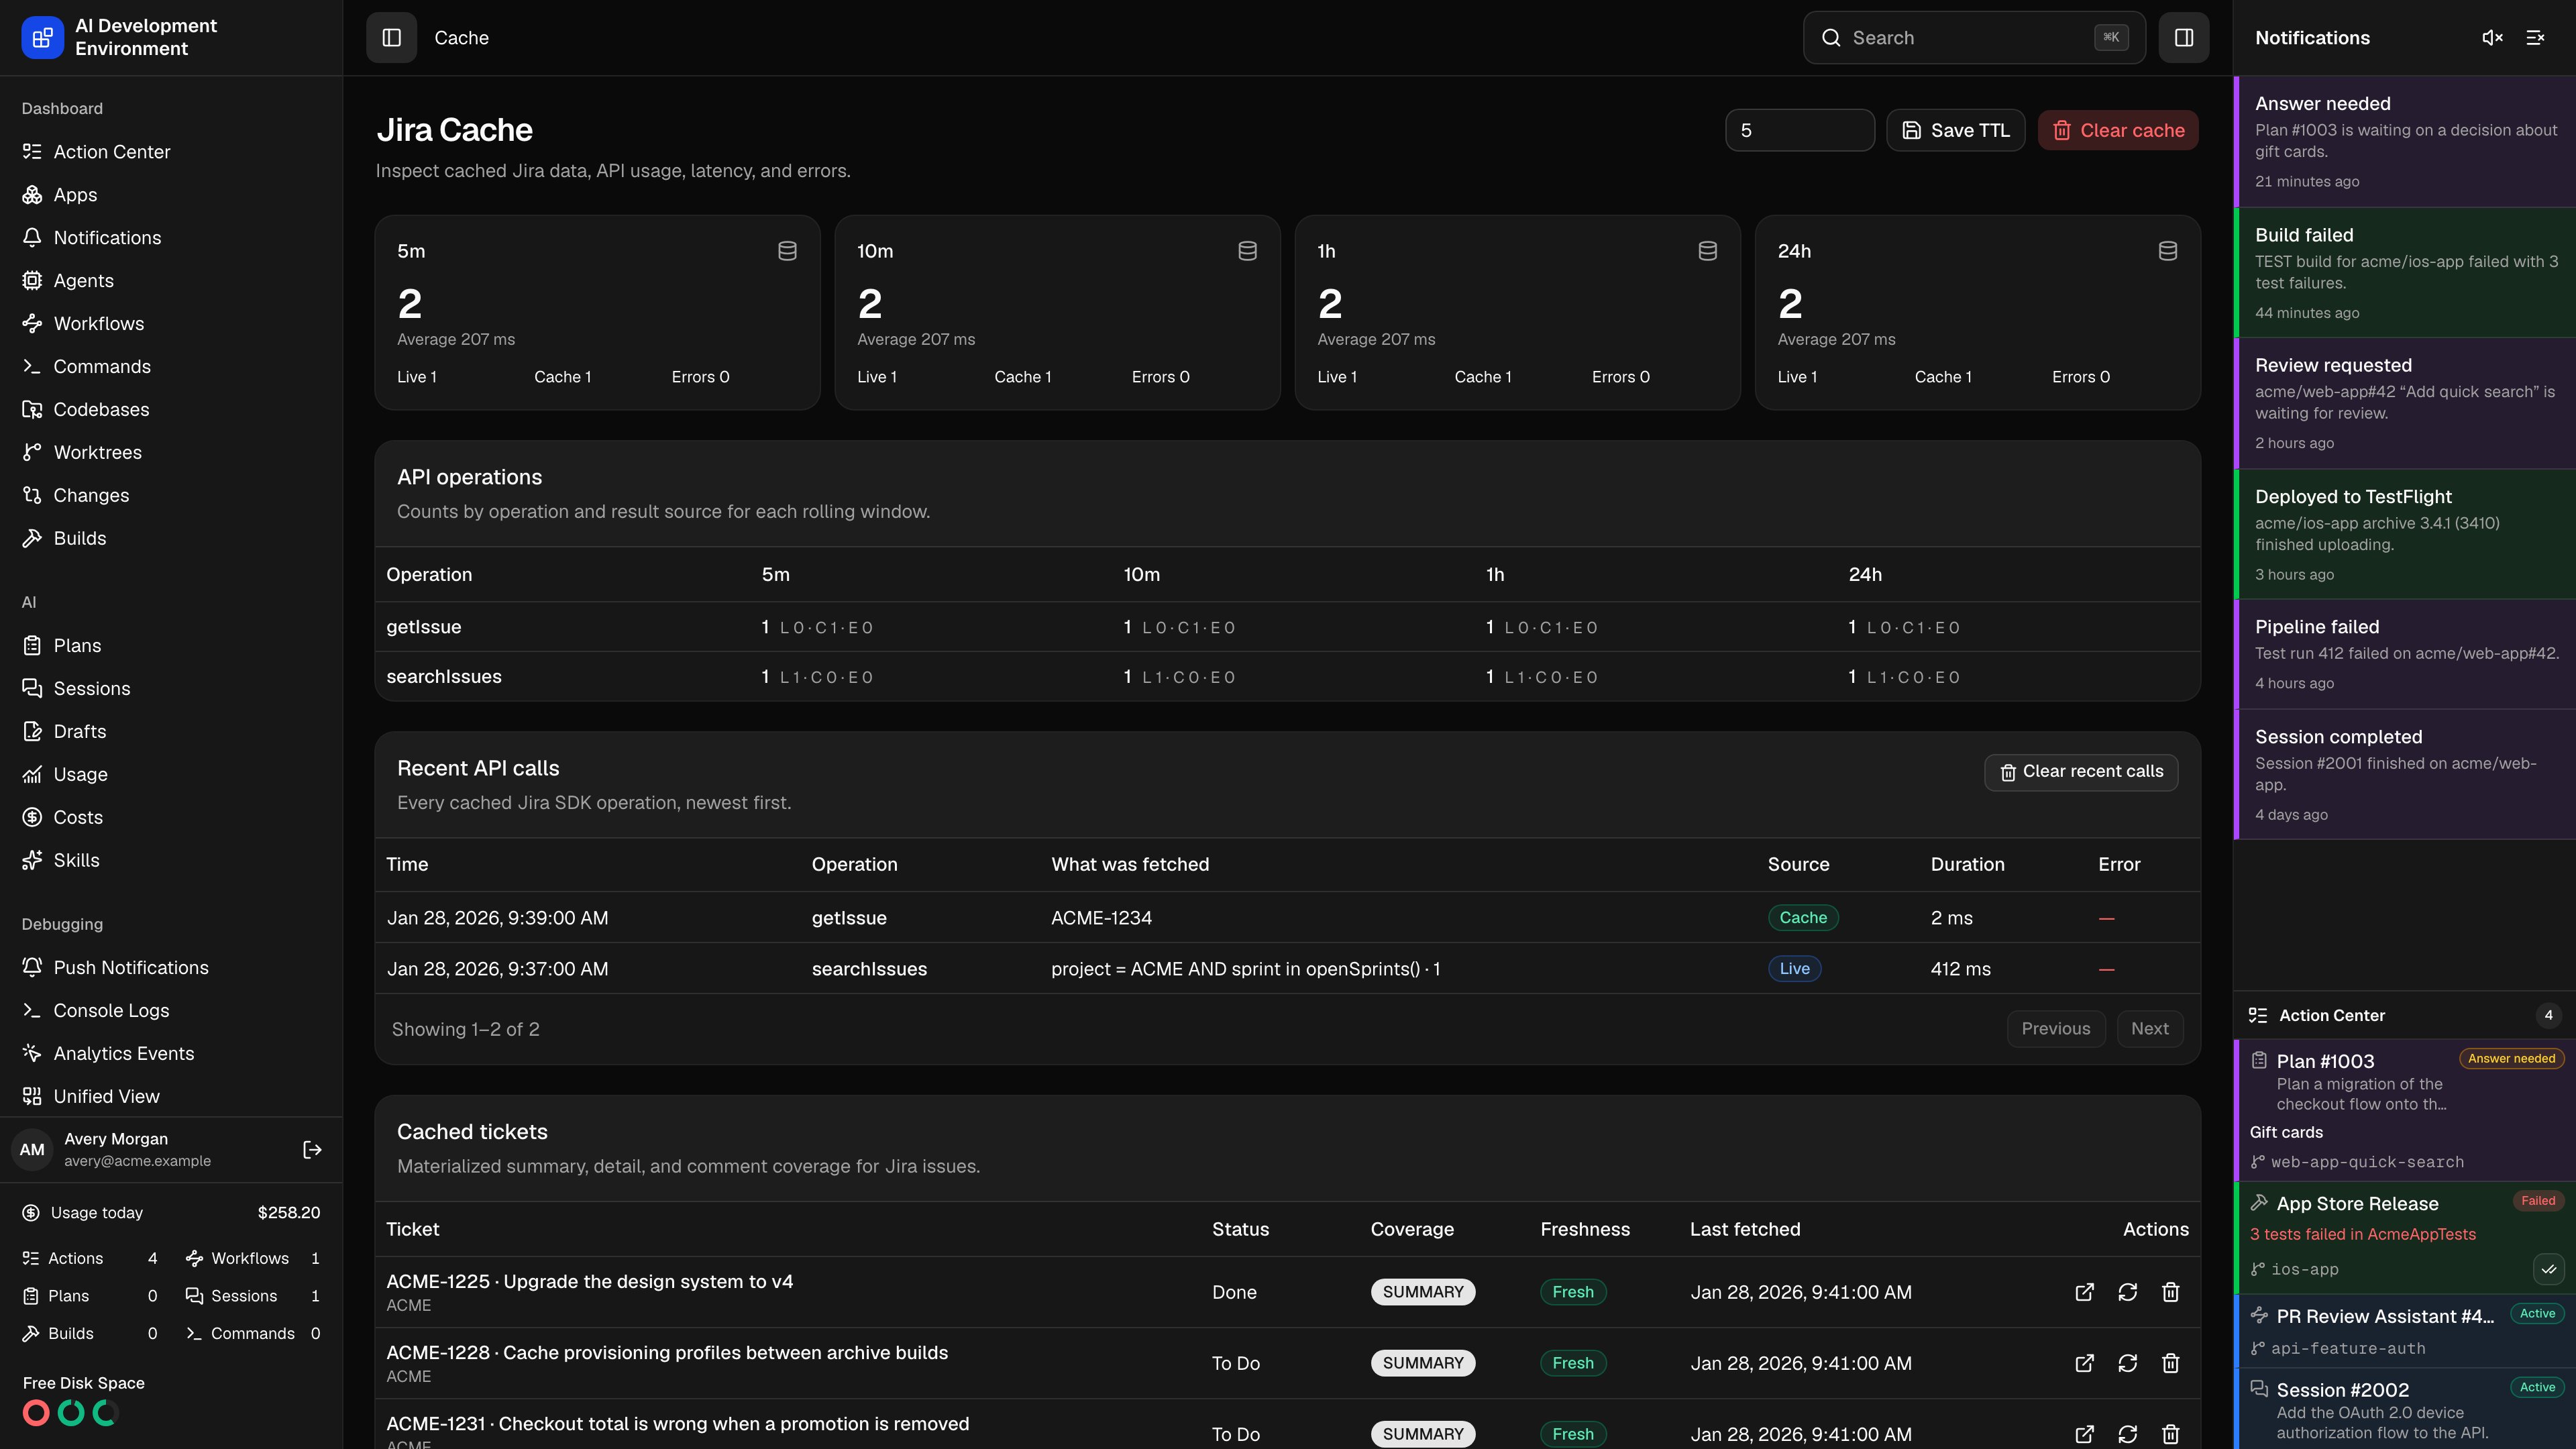 Every Jira read in this product goes through one persistent cache. The **Jira Cache** page at `/jira-cache` is where that cache is tuned and audited: how long responses stay fresh, how many calls each operation made, how many were answered without contacting Jira, how long they took, what failed, and which issues are materialized right now.
Open it when Jira feels slow, when a page is showing data you know is out of date, or when you want to see how much API traffic a board or a JQL query is actually generating.
## Cache TTL
The **Cache TTL** field at the top sets the freshness window in minutes, from 1 to 1440. The default is 5 minutes.
A cached response younger than the TTL is returned without contacting Jira. An older one triggers a live read on the next request. The TTL is global — it applies to every Jira operation.
TTL controls freshness, not polling. Shortening it does not make anything ask Jira more often; it only means the next ask will not be answered from cache.
## Usage metrics
The four cards across the top are rolling windows — 5 minutes, 10 minutes, 1 hour, and 24 hours. Each one reports the total number of calls in that window, the average duration, and the split between live reads, cache hits, and errors.
**API operations** breaks the same windows down by operation, so you can see which one is generating the traffic.
| Operation | Made by |
| ---------------------------------------------------------- | ------------------------------------------------- |
| `JQL_SEARCH` | A JQL source loading its tickets |
| `BOARD`, `BOARD_CONFIGURATION`, `BOARD_ISSUES` | A board source and its column layout |
| `SPRINTS`, `SPRINT_ISSUES` | A Scrum board's active sprints |
| `ISSUE`, `COMMENTS` | Opening a ticket |
| `ISSUE_CHANGELOG`, `ISSUE_WORKLOGS` | The activity tabs and description history |
| `ISSUE_TRANSITIONS`, `ISSUE_EDIT_META`, `ASSIGNABLE_USERS` | The status, edit, and assignee controls |
| `ISSUE_BRANCH` | Naming a branch for a ticket worktree |
| `PROJECTS`, `PROJECT`, `PROJECT_STATUSES`, `JQL_VALIDATE` | Managing projects and validating sources |
| `MYSELF` | Resolving your own account for assignment filters |
## Recent API calls
**Recent API calls** lists individual calls newest first, 50 per page.
| Column | Shows |
| -------------------- | --------------------------------------------------------------------------------------- |
| **Time** | When the call was made |
| **Operation** | The operation name |
| **What was fetched** | A summary of the request, plus the number of items returned |
| **Source** | **Live**, **Cache**, or **Error**, with a **Stale** marker when expired data was served |
| **Duration** | How long the call took, in milliseconds |
| **Error** | The failure message, when there is one |
**Clear recent calls** empties this log and keeps cached responses and tickets.
When a live read fails, the last cached response is served instead and the call is recorded as an error that served stale data. Pages showing stale data say so in a banner. If nothing is cached, the read fails outright.
Two calls for the same thing that arrive at once are coalesced into one request to Jira; the second is logged as a cache hit marked `(coalesced)`.
## Cached tickets
**Cached tickets** lists the Jira issues materialized from those responses — the summary, detail, and comment data pulled out of the raw cache entries and stored per issue.
| Column | Shows |
| ---------------- | ----------------------------------------------------------- |
| **Ticket** | Issue key, summary, and project key |
| **Status** | The status from the most complete stored data |
| **Coverage** | How much of the issue is stored |
| **Freshness** | Fresh, or Stale when any stored level is older than the TTL |
| **Last fetched** | When the detail — or, failing that, the summary — was read |
| Coverage | Means |
| ----------- | ------------------------------------------------------ |
| **Summary** | Only the list-level fields, from a board or JQL search |
| **Detail** | The full issue was read, but its comments were not |
| **Full** | Both the issue and its comments are stored |
| Action | Effect |
| --------------- | ------------------------------------------------------------------------------- |
| **Open** | Opens the [cached ticket](/jira/jira-cache-ticket) with its stored responses |
| **Refresh** | Re-reads that issue and its comments from Jira now |
| **Delete** | Removes the issue and every cache entry that references it |
| **Clear cache** | Removes every cached response and every cached ticket; the API call log is kept |
## Notes
* Entries are keyed by the Jira site URL, the operation, and the request parameters, so the same operation with different parameters is a separate entry.
* API tokens are stripped from error messages before anything is stored or shown.
* Any write — a transition, an assignment, a comment, a field edit — deletes that issue's cache entries and re-reads it live, so a change is never masked by a stale entry.
* Removing your Jira credentials, or changing the Jira site, clears cached Jira data as well.
* Call history older than 30 days is pruned automatically.
## Related pages
One issue's stored summary, detail, and comment responses.
Push changes from Jira instead of waiting for a fetch.
Every Jira read in this product goes through one persistent cache. The **Jira Cache** page at `/jira-cache` is where that cache is tuned and audited: how long responses stay fresh, how many calls each operation made, how many were answered without contacting Jira, how long they took, what failed, and which issues are materialized right now.
Open it when Jira feels slow, when a page is showing data you know is out of date, or when you want to see how much API traffic a board or a JQL query is actually generating.
## Cache TTL
The **Cache TTL** field at the top sets the freshness window in minutes, from 1 to 1440. The default is 5 minutes.
A cached response younger than the TTL is returned without contacting Jira. An older one triggers a live read on the next request. The TTL is global — it applies to every Jira operation.
TTL controls freshness, not polling. Shortening it does not make anything ask Jira more often; it only means the next ask will not be answered from cache.
## Usage metrics
The four cards across the top are rolling windows — 5 minutes, 10 minutes, 1 hour, and 24 hours. Each one reports the total number of calls in that window, the average duration, and the split between live reads, cache hits, and errors.
**API operations** breaks the same windows down by operation, so you can see which one is generating the traffic.
| Operation | Made by |
| ---------------------------------------------------------- | ------------------------------------------------- |
| `JQL_SEARCH` | A JQL source loading its tickets |
| `BOARD`, `BOARD_CONFIGURATION`, `BOARD_ISSUES` | A board source and its column layout |
| `SPRINTS`, `SPRINT_ISSUES` | A Scrum board's active sprints |
| `ISSUE`, `COMMENTS` | Opening a ticket |
| `ISSUE_CHANGELOG`, `ISSUE_WORKLOGS` | The activity tabs and description history |
| `ISSUE_TRANSITIONS`, `ISSUE_EDIT_META`, `ASSIGNABLE_USERS` | The status, edit, and assignee controls |
| `ISSUE_BRANCH` | Naming a branch for a ticket worktree |
| `PROJECTS`, `PROJECT`, `PROJECT_STATUSES`, `JQL_VALIDATE` | Managing projects and validating sources |
| `MYSELF` | Resolving your own account for assignment filters |
## Recent API calls
**Recent API calls** lists individual calls newest first, 50 per page.
| Column | Shows |
| -------------------- | --------------------------------------------------------------------------------------- |
| **Time** | When the call was made |
| **Operation** | The operation name |
| **What was fetched** | A summary of the request, plus the number of items returned |
| **Source** | **Live**, **Cache**, or **Error**, with a **Stale** marker when expired data was served |
| **Duration** | How long the call took, in milliseconds |
| **Error** | The failure message, when there is one |
**Clear recent calls** empties this log and keeps cached responses and tickets.
When a live read fails, the last cached response is served instead and the call is recorded as an error that served stale data. Pages showing stale data say so in a banner. If nothing is cached, the read fails outright.
Two calls for the same thing that arrive at once are coalesced into one request to Jira; the second is logged as a cache hit marked `(coalesced)`.
## Cached tickets
**Cached tickets** lists the Jira issues materialized from those responses — the summary, detail, and comment data pulled out of the raw cache entries and stored per issue.
| Column | Shows |
| ---------------- | ----------------------------------------------------------- |
| **Ticket** | Issue key, summary, and project key |
| **Status** | The status from the most complete stored data |
| **Coverage** | How much of the issue is stored |
| **Freshness** | Fresh, or Stale when any stored level is older than the TTL |
| **Last fetched** | When the detail — or, failing that, the summary — was read |
| Coverage | Means |
| ----------- | ------------------------------------------------------ |
| **Summary** | Only the list-level fields, from a board or JQL search |
| **Detail** | The full issue was read, but its comments were not |
| **Full** | Both the issue and its comments are stored |
| Action | Effect |
| --------------- | ------------------------------------------------------------------------------- |
| **Open** | Opens the [cached ticket](/jira/jira-cache-ticket) with its stored responses |
| **Refresh** | Re-reads that issue and its comments from Jira now |
| **Delete** | Removes the issue and every cache entry that references it |
| **Clear cache** | Removes every cached response and every cached ticket; the API call log is kept |
## Notes
* Entries are keyed by the Jira site URL, the operation, and the request parameters, so the same operation with different parameters is a separate entry.
* API tokens are stripped from error messages before anything is stored or shown.
* Any write — a transition, an assignment, a comment, a field edit — deletes that issue's cache entries and re-reads it live, so a change is never masked by a stale entry.
* Removing your Jira credentials, or changing the Jira site, clears cached Jira data as well.
* Call history older than 30 days is pruned automatically.
## Related pages
One issue's stored summary, detail, and comment responses.
Push changes from Jira instead of waiting for a fetch.