

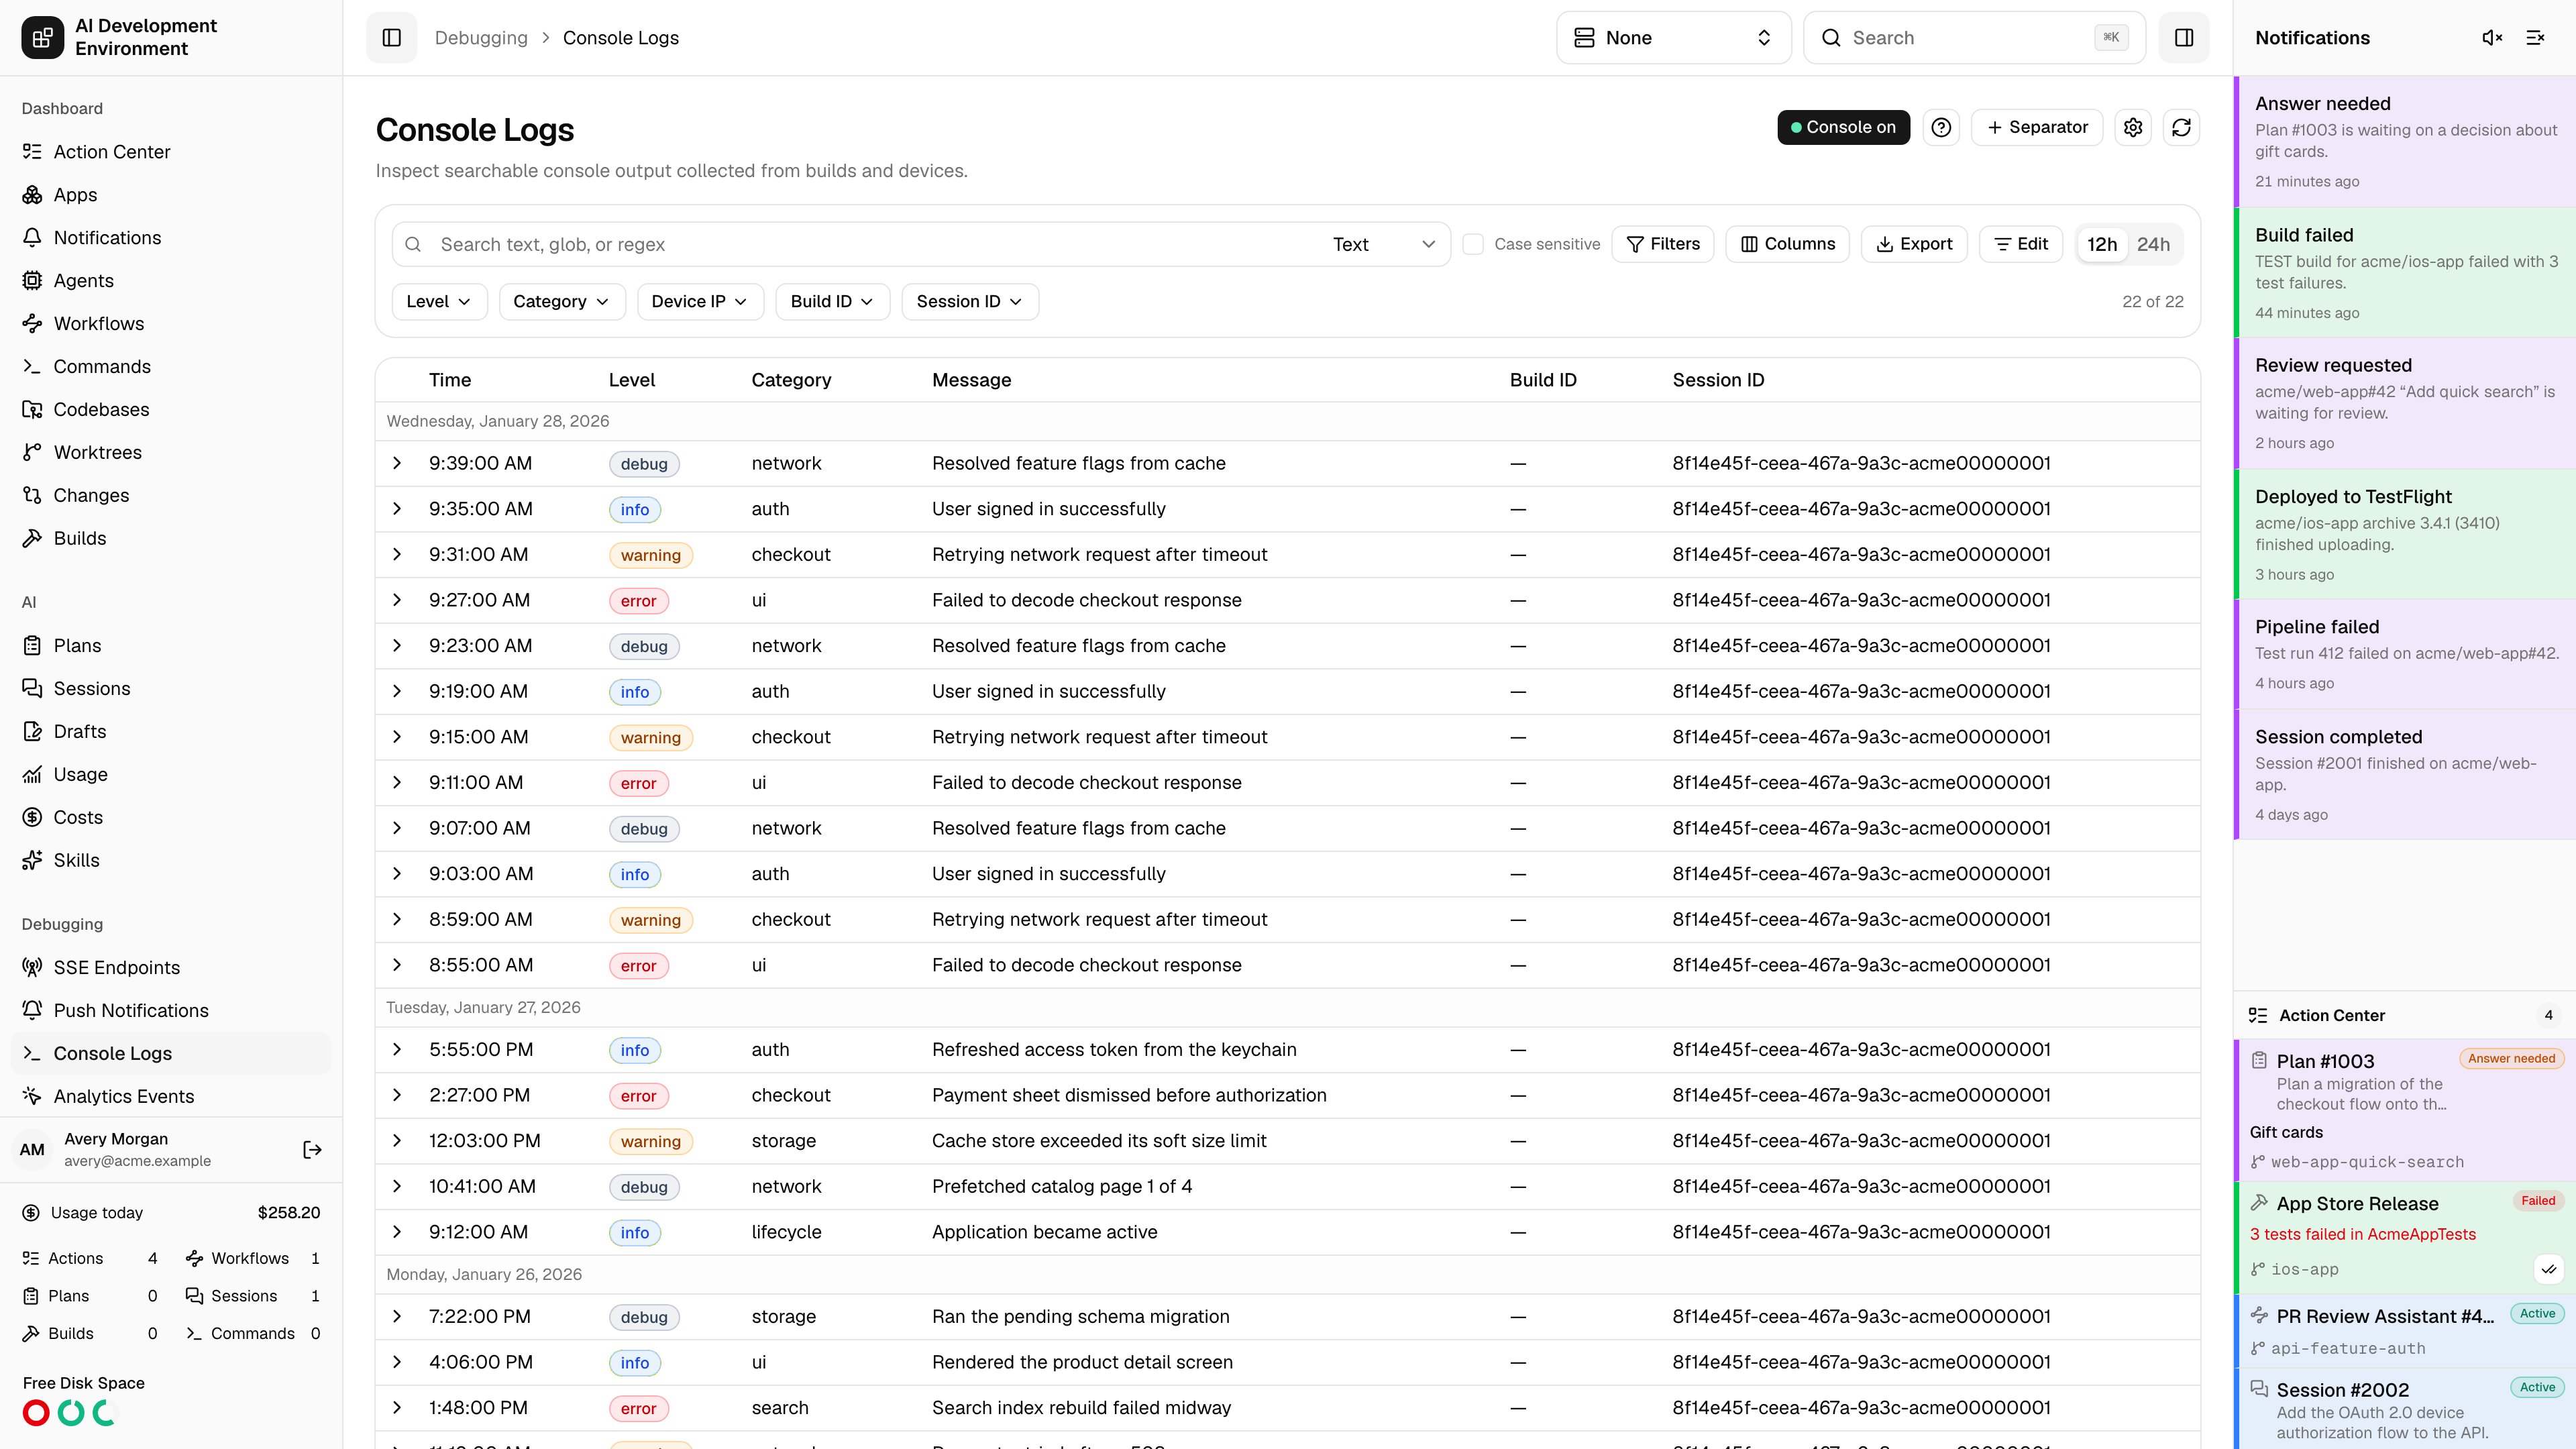
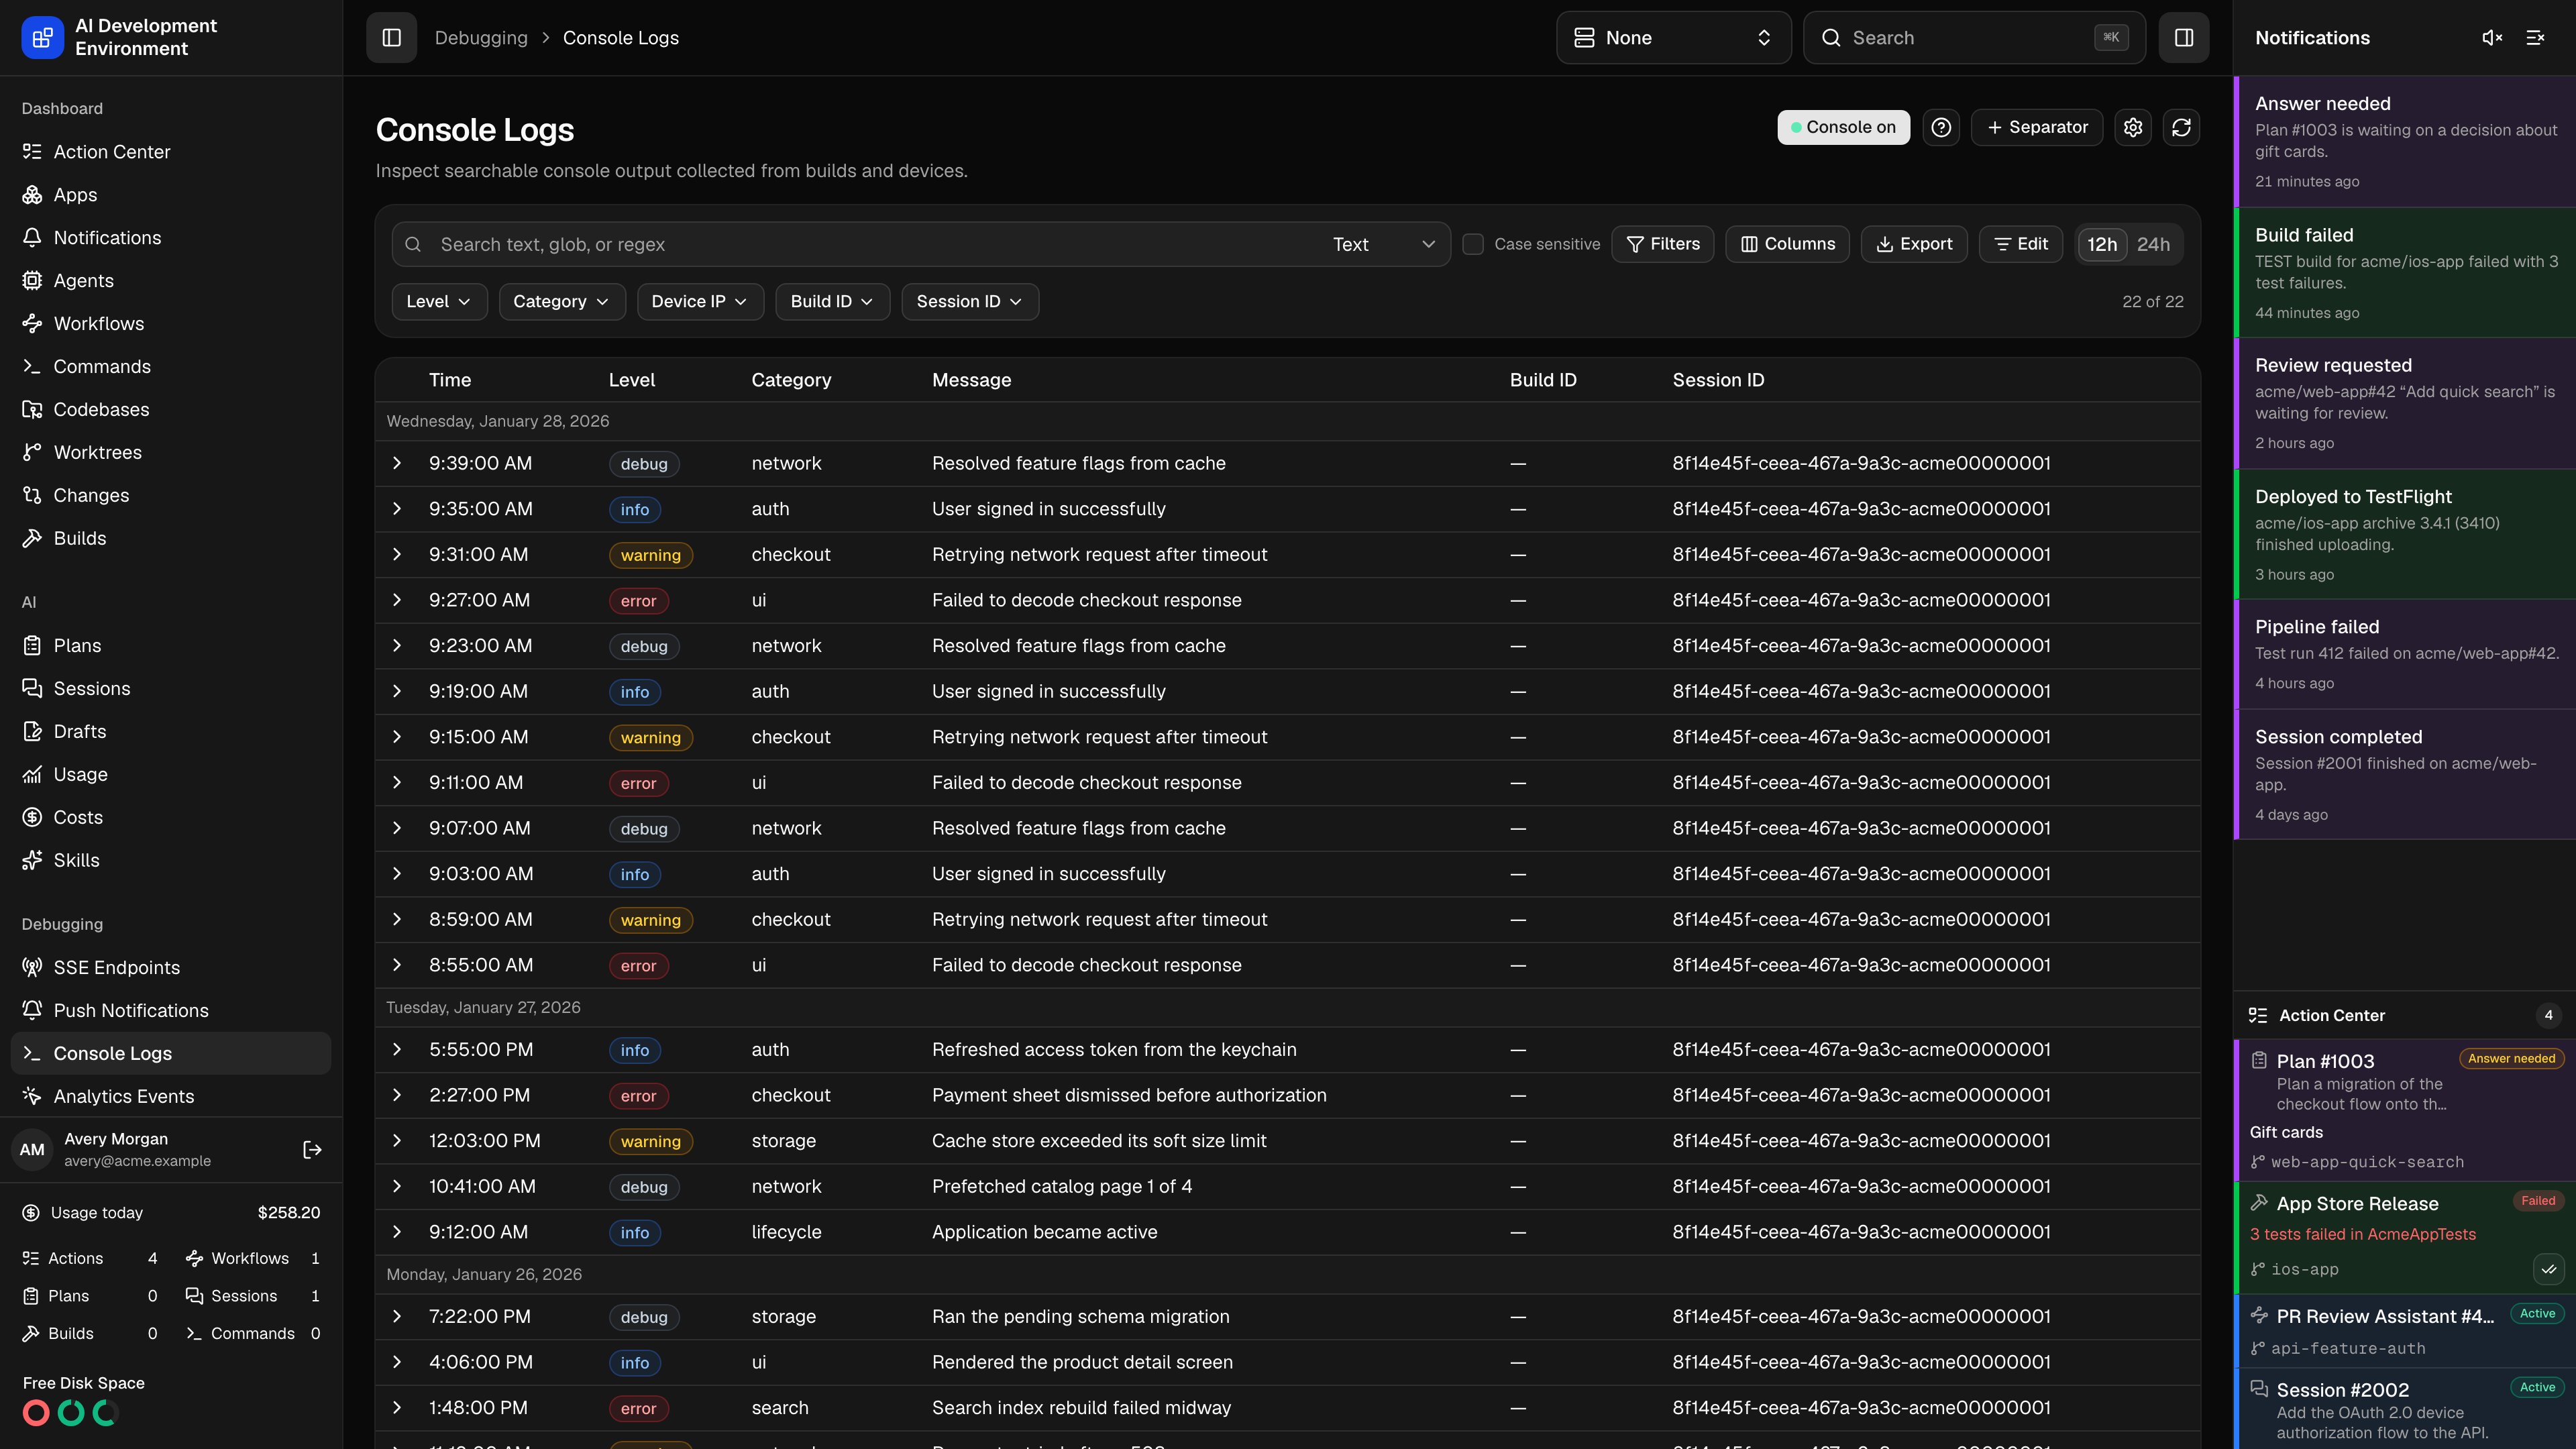
/debugging/console-logs is a live log viewer for the apps you build here. Your app posts structured log records to a REST endpoint on the control plane, and this page stores, searches, annotates, and exports them — so output you saw on a device five builds ago is still there, still searchable, next to the build that produced it.
It is one of three views over the same timeline. Console Logs shows console records only; Analytics Events shows product events only; the Unified View interleaves both.
What a console record contains
Every record your app sends carries seven fields. The server adds three more on arrival.level and category are not enumerations. Whatever strings your app sends
become the values you can filter on. The page colors well-known ones — error
and fatal red, warn amber, debug and trace grey, info blue — and
assigns a stable color to everything else.attributes is flattened into dotted paths — {"cache": {"hit": true}} becomes the field cache.hit — and each path becomes searchable, filterable, and available as a table column.
Searching
The search box matches against a flattened text rendering of the whole record: every field name and every value, including nested attribute paths. Three modes are available from the dropdown beside the box.
Case sensitive applies to whichever mode is active. Patterns are limited to 1024 characters, and searching is debounced, so the timeline updates shortly after you stop typing.
Filtering
Quick filters
Five dropdowns sit under the search box — Level, Category, Device IP, Build ID, and Session ID. Each lists the distinct values actually present in the stored records, so an empty dropdown means nothing has arrived with that field yet. Selecting several values within one dropdown matches any of them; selections across dropdowns must all match.Advanced filters
Filters opens a sheet for conditions that quick filters cannot express. Each condition targets one field — including flattened attribute paths — with an operator and a value.
Set Match to All conditions or Any condition, and give each condition its own case sensitivity. The Filters button shows a badge with the number of active conditions.
Right-clicking any cell or attribute row offers Filter by value, which adds the right condition for you — a quick filter if the field has one, otherwise an advanced condition.
Saved filters
Name a set of conditions and Save filter to reuse it. Saved filters are stored per view, so a Console Logs filter does not clutter the Analytics Events sheet. The filter marked active is reapplied the next time you open the page.Columns
Columns opens the column manager. The starting set is Time, Level, Category, Message, Build ID, and Session ID; Device IP, Received, and Attributes are also available, along with every attribute path discovered in the stored records.Choose and order
Add fields, remove them, and move them up or down. Up to 100 columns are
allowed, and one must always remain.
Promote an attribute
Expand a record and click the + beside any attribute path to add it as a
column without opening the manager. Hover a column header and click ✕ to
drop it again.
Save a preset
Name the current layout and save it. Mark one preset as the default for this
view, or Reset columns to return to the shipped set.
Reading the timeline
Records are listed newest first, 200 at a time, with Load more at the bottom. The counter above the table reads matching of total.- Rows are grouped under a local-day header.
- Clicking a row expands it: the full message, a metadata grid — time, received, device IP, build ID, session ID, level, category — and the attributes dictionary rendered as path and value pairs.
- Newly arrived rows flash briefly, so you can see ingestion happening live.
- Right-click a cell for Copy
<column>: value, Copy value, and Filter by value. Right-click the attributes block for Copy JSON dictionary or Copy path: values. - The expanded row carries a Highlight swatch strip — 19 colors plus a clear button — that tints the row for everyone using the app, and a Delete button for that single record.
Separators
Separators are horizontal markers in the timeline. They are shared across all three views and come from two places.
Because a build separator lands at the moment the build was created, everything above it is output from that build. Hovering a separator reveals a delete button.
Editing and clearing
Edit turns on selection checkboxes and a destructive toolbar.Select
Check individual rows, a whole day via its header, everything above a
separator via that separator’s checkbox, or Select all matching rows in
the header — which selects the entire filtered result set, not just what is
loaded.
Clear selected
Deletes exactly what is selected. With Select all active it deletes
every record matching the current search and filters, minus anything you
unchecked.
Clear all
Asks whether to Clear records or Clear with separators, then deletes
every console record — filters are ignored.
Clear before latest separator
Deletes everything older than the most recent separator. Useful for keeping
only the current build’s output.
Exporting
Export writes the current view to a file. When rows are selected the dialog exports the selection; otherwise it exports everything matching the current search and filters.- Formats: CSV, Markdown, and PDF.
- Pick up to 30 fields; the export starts from your current columns.
- Your locale, time zone, and 12h/24h preference are applied to timestamps.
- The file downloads as
observability-<YYYY-MM-DD>.<ext>, and the export records the search and filters that produced it.
Collection and endpoints
The header button reading Console on or Console off is the ingestion switch. Turning it off does not reject requests — the endpoint keeps validating payloads and answers202 Accepted without storing anything, so a device in the field never sees an error.
The gear icon opens Observability settings, shared by all three views, with collection controls and copyable Local, Remote, and configured Proxy endpoints. URL editing lives in Settings → Server URLs; Manage server URLs opens it. The same settings apply to analytics, SSE, crash uploads, enrollment, and MCP.
Build hooks receive server.selectedBaseUrl, endpointPaths.consoleLogs, and the collection flags. Compose the URL with new URL(endpointPaths.consoleLogs, server.selectedBaseUrl). See the hook contract for all paths and environment variables.
Sending console logs
The ? icon in the header opens Send console logs, which renders the ingestion contract against your own configured origins and offers Copy Markdown docs to paste into a client project. Send one record, or an atomic batch as{ "items": [...] } with up to 500 records. The endpoint is unauthenticated, Content-Type must be application/json, and the request body is capped at 2 MiB.
Validation rules
All seven fields are required, and unknown fields are rejected. Server-owned fields —id, entryType, receivedAt, deviceIp, highlightColor, separatorKind, separatorName — may be present but are ignored.
Responses
Live updates
The page subscribes to telemetry changes and reconciles in place. New records appear as they are ingested, highlights and deletions from other browsers apply immediately, and settings changes made elsewhere refresh the toolbar. Returning to the tab triggers a reconcile, so you never look at a stale timeline.Related pages
Analytics Events
Product events with their default and additional parameters.
Unified View
Console logs and analytics events in one timeline.
Build details
The build a separator marks, with its own log stream.
GraphQL API
telemetryTimeline, clearTelemetry, and the rest of the telemetry graph.